
Extended Data Figure 1. Marker genes demonstrating cell type identity of immune cell clusters.
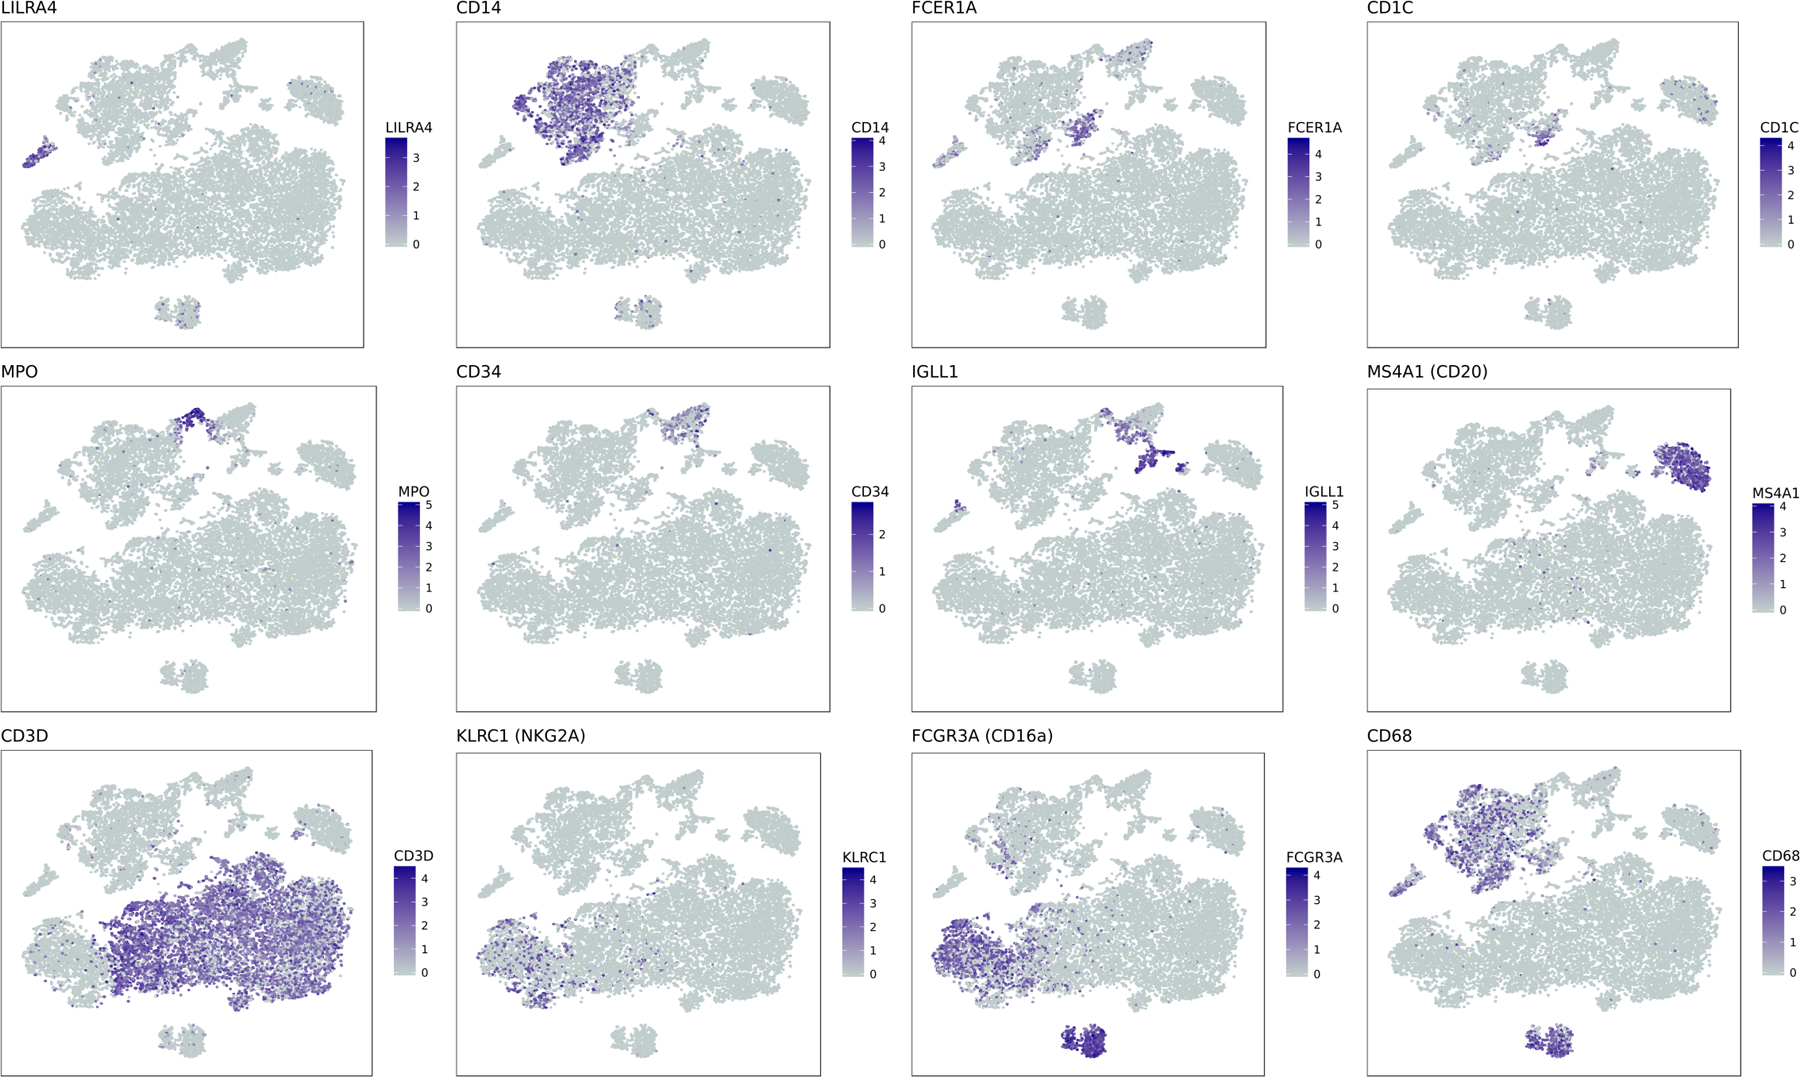
tSNE representation of CD45 cell populations. In each subplot, cells are colored by log-normalized expression values for a given cell type specific marker gene.