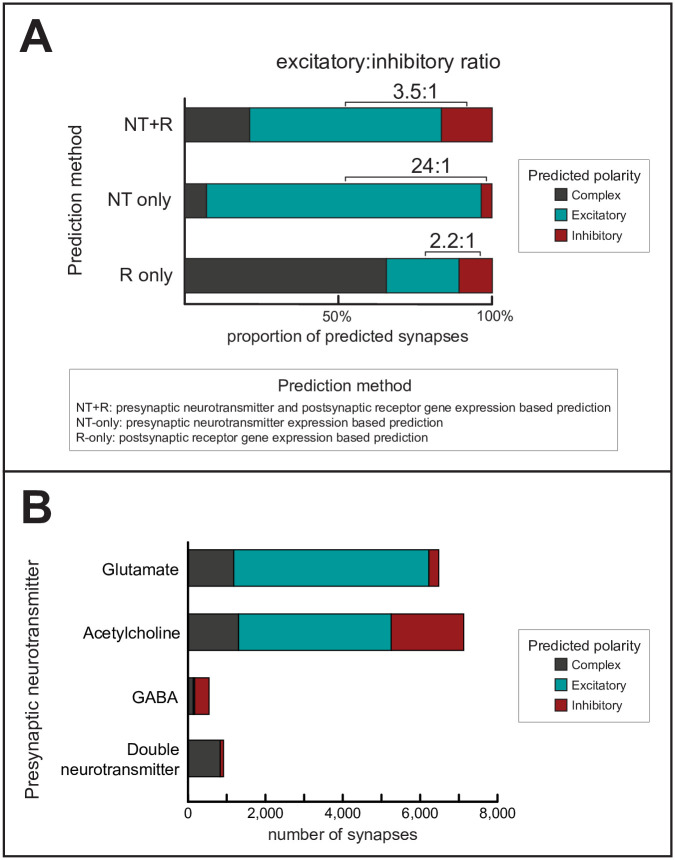
Fig 3. Predicted synaptic polarities.
(A) Distributions of predicted polarities, using the method developed in this paper (NT+R) and two alternative methods as comparison (NT-only and R-only). Polarities were predicted by considering the neurotransmitter expression of the presynaptic neuron and/or the receptor gene expression of the postsynaptic neuron (see Methods). (B) Distributions of predicted synaptic polarities (using the NT+R method) according to the presynaptic neurotransmitter. Colors are the same as in panel A. Unpredicted synapses are not shown.

