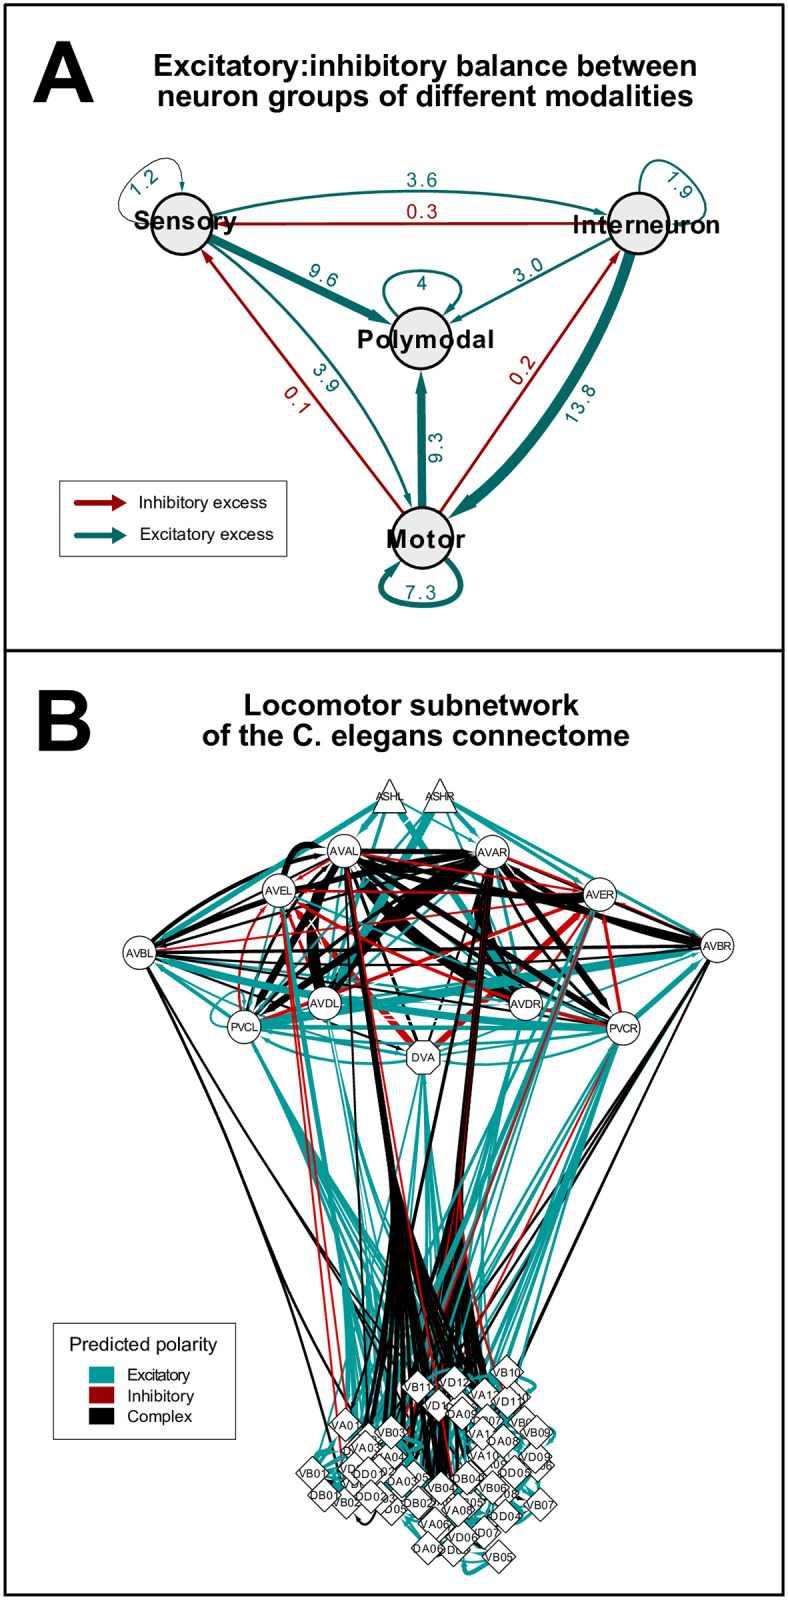
Fig 4. Excitatory:inhibitory balance of different neuron groups.

(A) Excitatory:inhibitory balance between neuron groups of different modalities. Nodes represent groups of neurons by modality. Edges are weighted according to the excitatory:inhibitory (E:I) ratios (see numbers). Green and red colors represent excitatory (E:I>1) and inhibitory (E:I<1) excess in sign-balances, respectively. (B) Network representation of the locomotion subnetwork. Edges represent excitatory (blue), inhibitory (red), or complex (black) chemical connections. Edges are weighted according to synapse number. The shape of vertices (Δ,○,◇) represent the modality (sensory, inter, motor, respectively) of neurons. Separate representations of the head circuit and the ventral nerve cord motor neurons are in S2 Fig.
