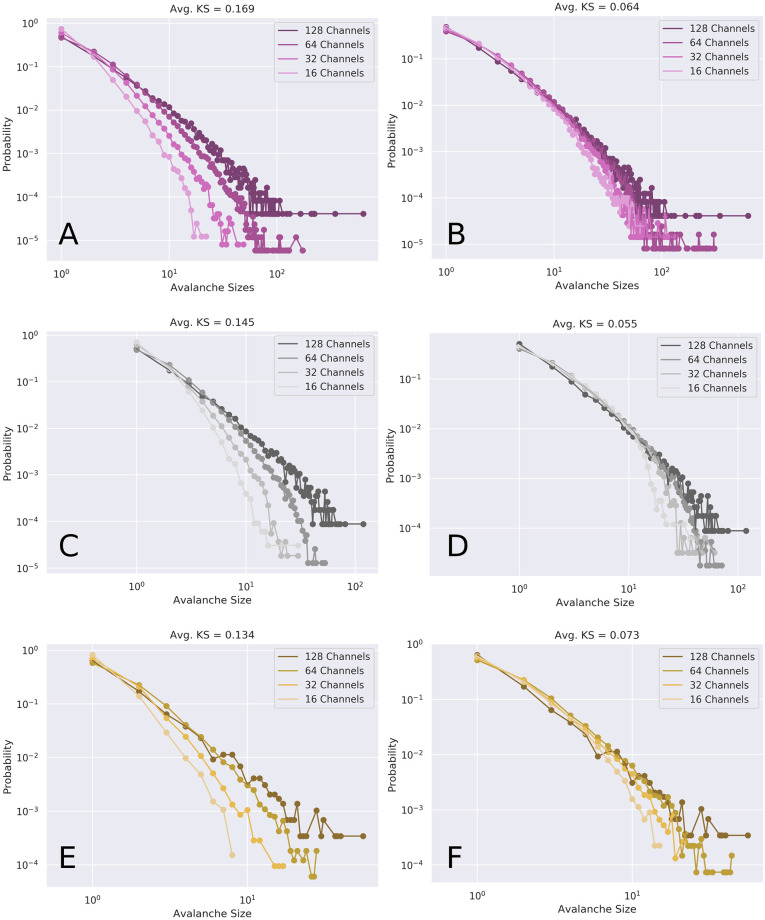
Fig 9. Data collapse under rescaling.
Shape collapse for the various subsampled avalanche sizes before (left column) and after (right column) renormalizing (rebinning) the binary timeseries. The color indicators are consistent with other figures: purple is awake (A, B), grey is ketamine (C, D), yellow is propofol (E, F). In all conditions, renormalization resulted in noticeable shape collapse, which can be quantified by doing pairwise calculations of the Wasserstein distance metric. Unlike Figs 7 and 8, this does not show all scans, but rather, representative examples of shape collapse for each of the three conditions.

