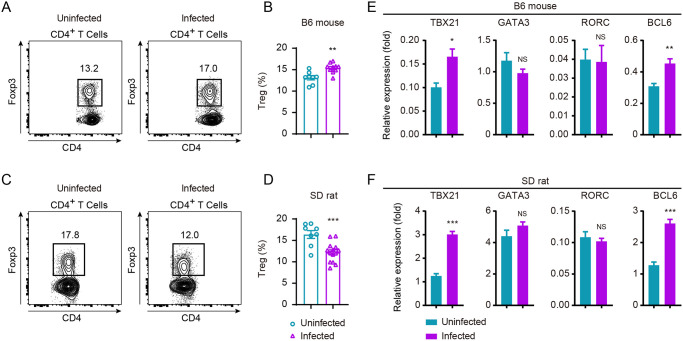
Fig 6. Comparison of Treg frequency and transcription factors expression of B6 mouse and SD rat upon S. japonicum infection.
(A, C) FACS analysis of FOXP3+ Tregs from B6 mouse (A) or SD rat (C) under uninfected and infected conditions. Expression of FOXP3 on CD4+ T cells from uninfected and 6-week S. japonicum-infected mice or rat. (B) Quantification of data in A. Data is representative of two experiments (uninfected B6 mouse, n = 8; infected B6 mouse, n = 10). (D) Quantification of data in C. Results represent for three experiments (uninfected rat, n = 8; infected rat, n = 14). (E, F) mRNA expression of transcription factor TBX21 (T-bet), GATA3, RORC or BCL6 of FACS-sorted CD4+ T cells from B6 mouse (E) or SD rat (F) under uninfected and infected conditions by using real-time PCR. Hprt or Sdha was used as internal controls for mice or rat, respectively. Relative mRNA levels are presented as mean ± s.e.m. The following fluorochrome-tagged antibodies were used: anti-mouse CD45-APC-eFluor 780, anti-mouse CD5-eFluor 450, anti-mouse CD4-Brilliant Violet 605, anti-mouse FOXP3-PE, anti-rat CD45-eFluor450, anti-rat CD3-APC, anti-rat CD4-APC/Cyanine7, anti-rat FOXP3-PE. Data represent the mean ± s.e.m. Statistical significance was assessed by unpaired Student’s t-test or non-parametric unpaired Mann-Whitney test and indicated by *, P<0.05; **, P<0.01; ***, P<0.0001; NS, non-significant.

