
Fig 2. Search paths for the parameters’ CI endpoints of the cancer taxol treatment model.
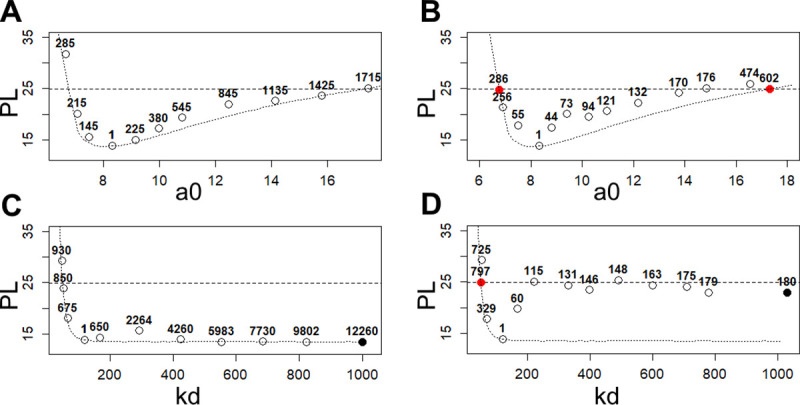
The path of CI search for stepwise optimization-based algorithm (A, C) and CICO algorithm (B, D). Circles denote the points reached by the algorithm during the search and numbers above the circles indicate the number of likelihood function calls the algorithm makes to reach this point. The dotted line is the likelihood profile calculated separately for illustrative purposes. The dashed horizontal line marks the significance level α = 0.95. Red circles mark the estimated endpoints (if they exist) for CICO algorithm and black–the points, where the algorithm reaches the box constraints. It denotes non-identifiable case. (A) Estimation of lower and upper CI endpoints with the stepwise optimization-based method for a0 parameter. (B) Estimation of lower and upper CI endpoints with CICO method for a0 parameter. (C) Estimation of lower and upper CI endpoints with the stepwise optimization-based method for kd parameter. (D) Estimation of lower and upper CI endpoints with CICO method for kd parameter.