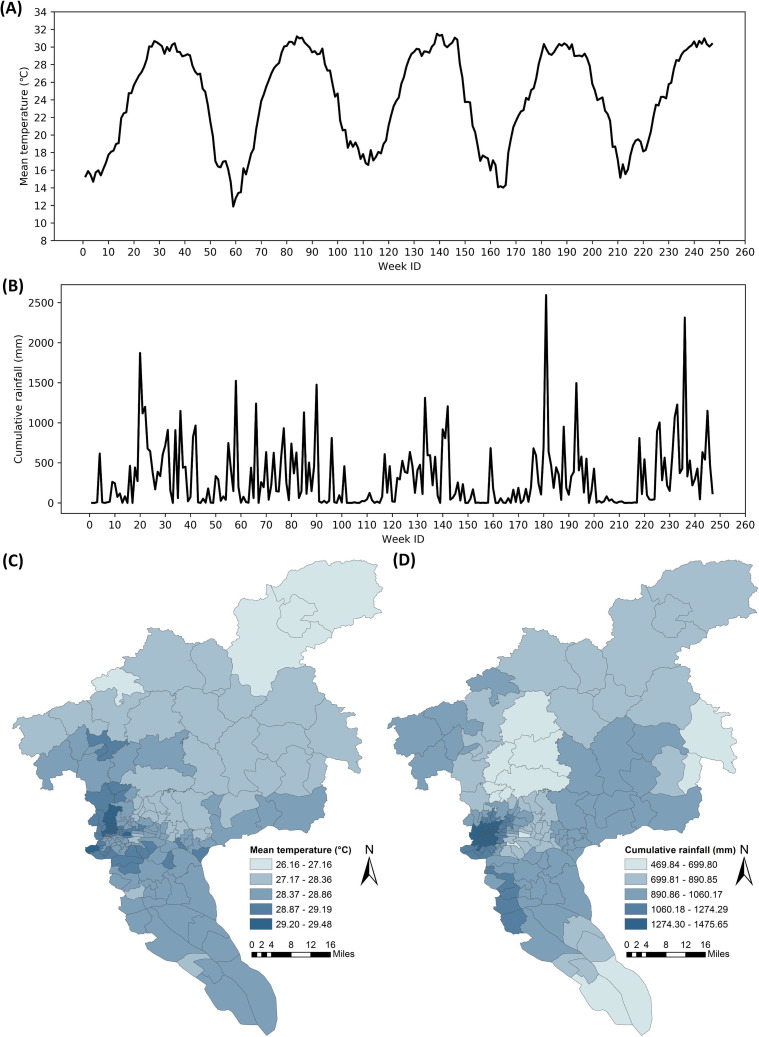
Fig 3. Meteorological data in Guangzhou City.
(A) Weekly mean temperature of an arbitrarily selected township from January 2015 to September 2019. (B) Weekly cumulative rainfall of an arbitrarily selected township from January 2015 to September 2019. (C) Weekly mean temperature and (D) weekly cumulative rainfall of all townships within the city during the week of September 12–18, 2016.

