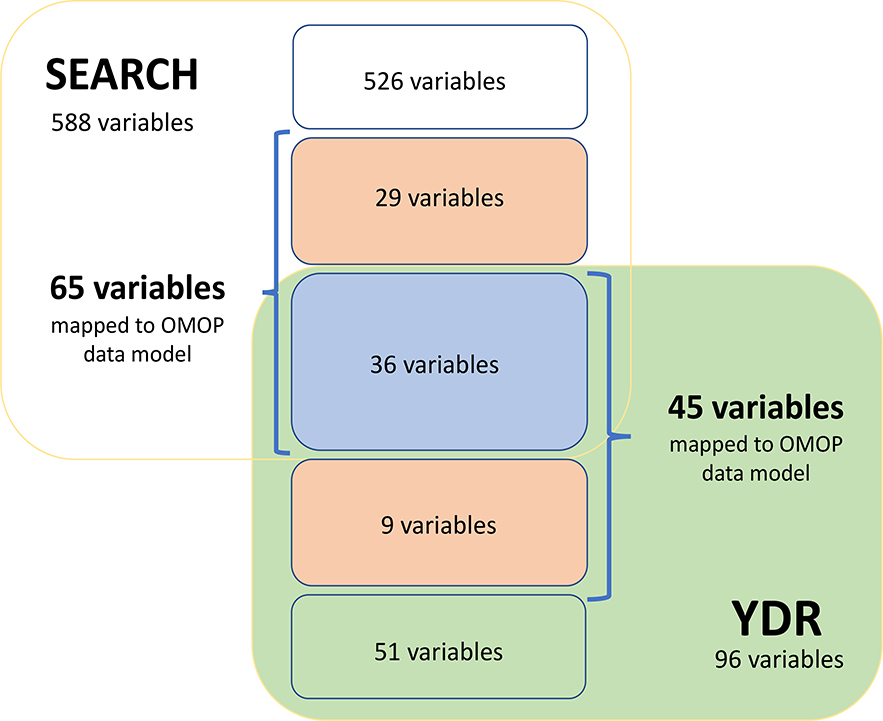
Figure 1.
A diagram showing the number of variables identified as possible matches between the SEARCH (yellow square) and YDR (green square) registries and how many were mapped to the OMOP data model (within the blue brackets) and of those mapped to the OMOP data model, how many were mapped to the standard OMOP terminologies (blue box) and how many were mapped to custom terminologies (orange boxes).

