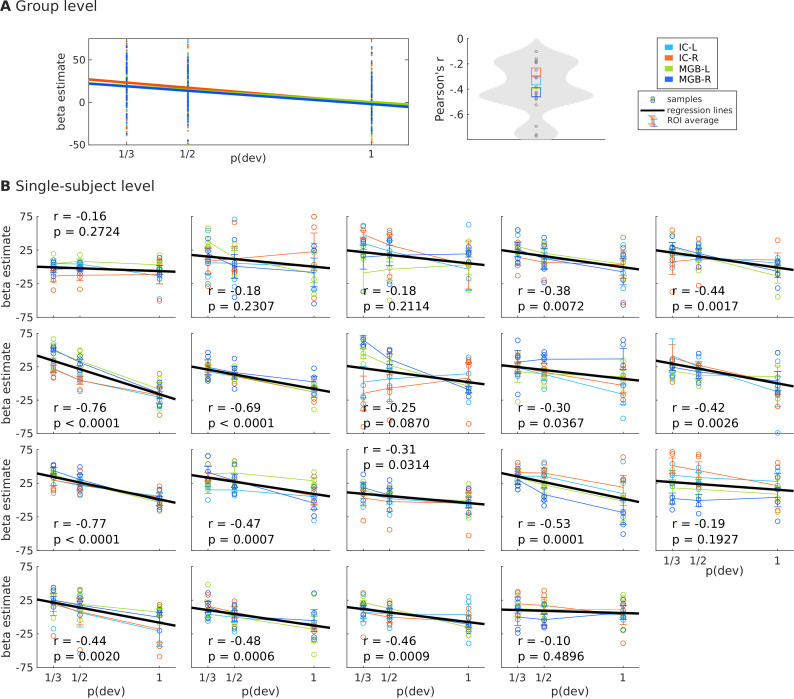
Figure 3. BOLD responses in the four ROIs to the three different positions of the deviants.
Kernel density estimations of the distribution of z-scores of the estimated BOLD responses, averaged over voxels of each ROI, to the three deviant positions (dev4, dev5, dev6) in each of the four ROIs: left and right IC, and left and right MGB (IC-L, IC-R, MGB-L, MGB-R). Responses to the three different standards (, , ) are displayed for reference. Each distribution holds 19 samples, one per subject. Error bars signal the mean and standard error of the distributions. * , ** , *** , **** ; all p-values are Holm-Bonferroni corrected for comparisons. , first standard; : standards preceding the deviant; : standards following the deviant; , , and : deviants at positions 4, 5, and 6, respectively.


