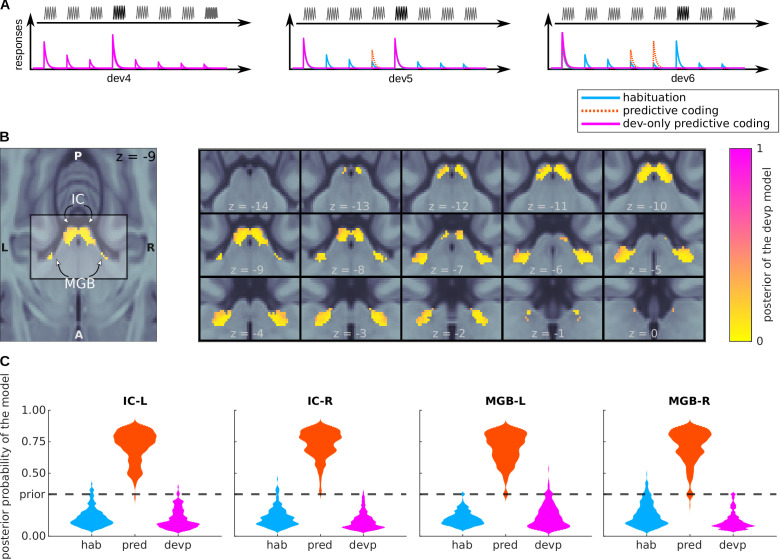
Figure 6. Bayesian model comparison of a variation of the predictive coding model.
(A) Design: relative amplitudes assumed by the habituation, predictive coding, and deviant-only predictive coding model. The first two models are identical to the ones defined in Figure 4A. (B) Posterior probability map of the deviant-only predictive coding model. Since three models were considered when computing the posteriors, means that the deviant-only predictive coding model is not the most likely explanation of the data, but does not necessarily mean that the deviant-only predictive coding model is the most likely explanation of the data. (C) Histograms showing the prevalence of each of the three models in each of the SSA regions.

