
Figure 1. Statistical power in the noncoding genome.
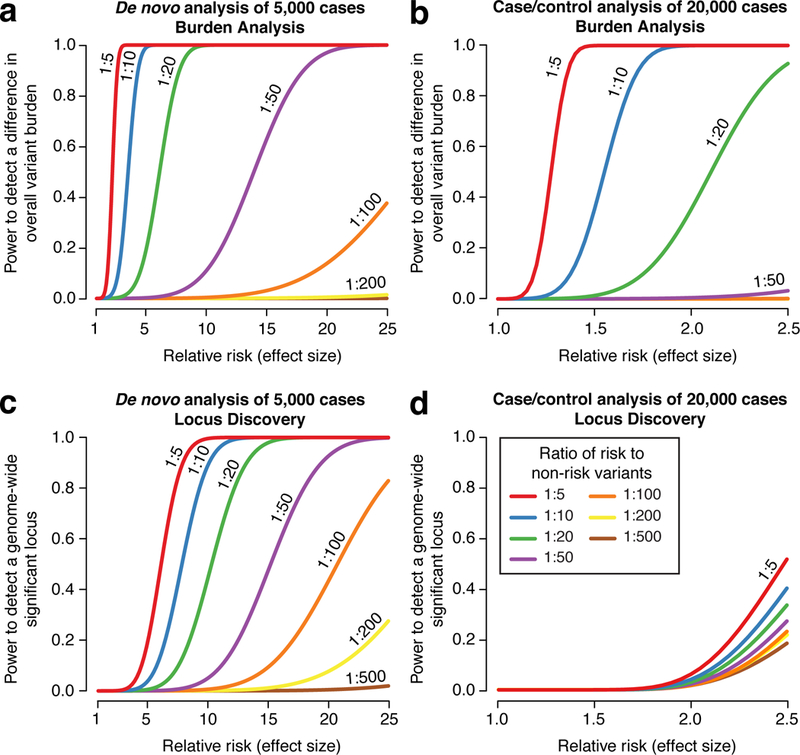
We estimated the power at a significance threshold (alpha) of 5 × 10⁻⁵, selected to account for 1,000 categories of noncoding variants, to detect an excess of noncoding variants at 122,500 risk loci in cases vs. controls as we varied the relative risk and risk:non-risk ratio, which represents annotation quality (Table S2). In a) we assessed the power for detecting an excess of de novo mutations in 5,000 cases vs. 5,000 controls as the relative risk increases. With a risk:non-risk ratio of 1:20, approximately equivalent to assessing protein truncating variants in the coding genome, we achieve >80% power with a relative risk of 5. In b) the power to detect an excess burden of rare variants (allele frequency ≤0.1%) is assessed in 20,000 cases vs. 20,000 controls. In c) we assessed the power to identify an excess of de novo mutations at a specific genomic locus, e.g. the noncoding region regulating a single gene. Consequently, we set the significance threshold (alpha) at 2.5×10⁻⁶. In d) we assessed the power to identify an excess of rare variants (allele frequency ≤0.1%) at a specific nucleotide (alpha = 1.7×10⁻¹¹), since this yielded better power than testing for burden at a locus (alpha = 2.5×10⁻⁶).