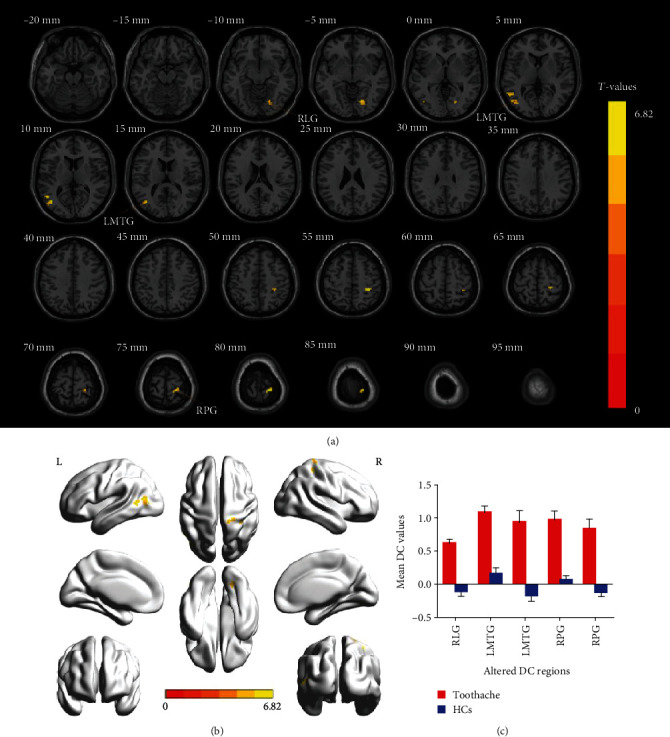
Figure 2.

Voxel-wise comparison of DC in the toothache and healthy control group. (a, b) Significant differences in DC were observed. The yellow regions indicate higher DC values. AlphaSim corrected at a cluster size > 40 voxels and a level of p < 0.05 for multiple comparisons using Gaussian random field theory. (c) The mean DC values between the TA and HC groups. Abbreviations: DC: degree centrality; TA: toothache; HC: healthy control; RLG: right lingual gyrus; LMTG: left middle temporal gyrus; RPG: right precentral gyrus.
