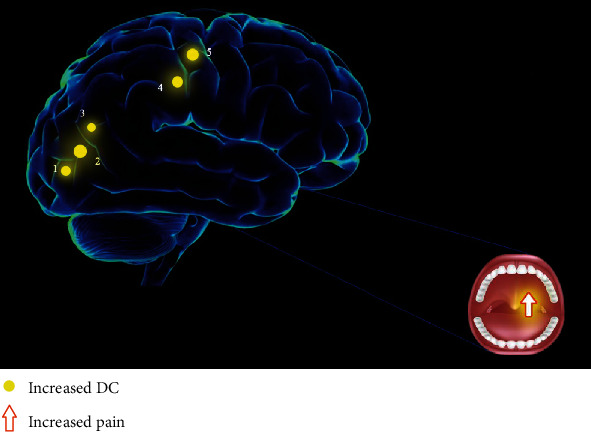
Figure 5.

The DC results of cerebral activity in the TA group. Compared with the HCs, the DC values of the following regions were increased to various extents: 1, right lingual gyrus (t = 6.1635); 2, left middle temporal gyrus (t = 6.8246); 3, left middle temporal gyrus (t = 6.0745); 4, right precentral gyrus (t = 6.5673); and 5, right precentral gyrus (t = 6.6338) in TA patients. The sizes of the spots denote the degree of quantitative changes. Abbreviations: DC: degree centrality; TA: toothache; HC: healthy control.
