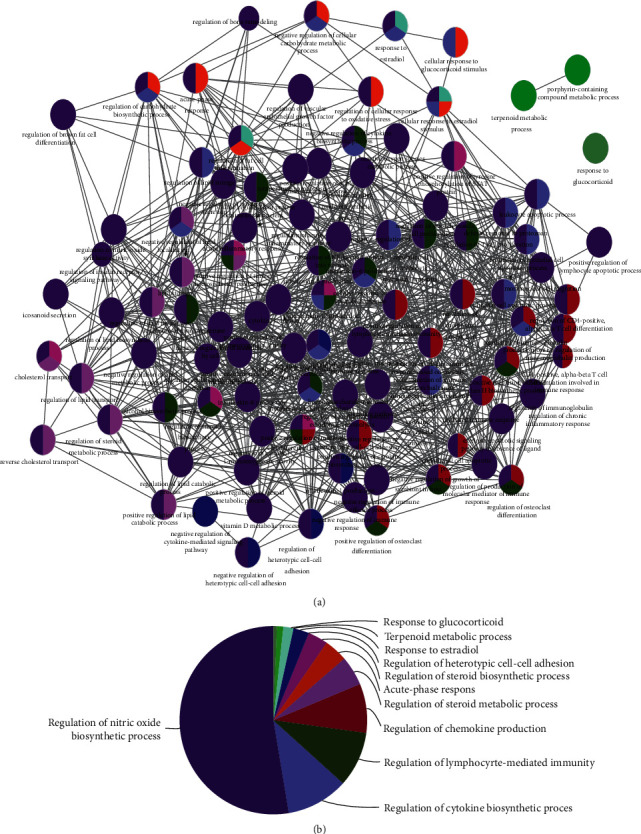
Figure 2.

The results of gene ontology (GO) functional analyses. (a) GO functional network for the 27 target genes. The nodes represent GO functional terms; larger nodes represent more significant P values; lines represent the correlation between functional terms. (b) Pie chart showing the clusters of the GO functional terms.
