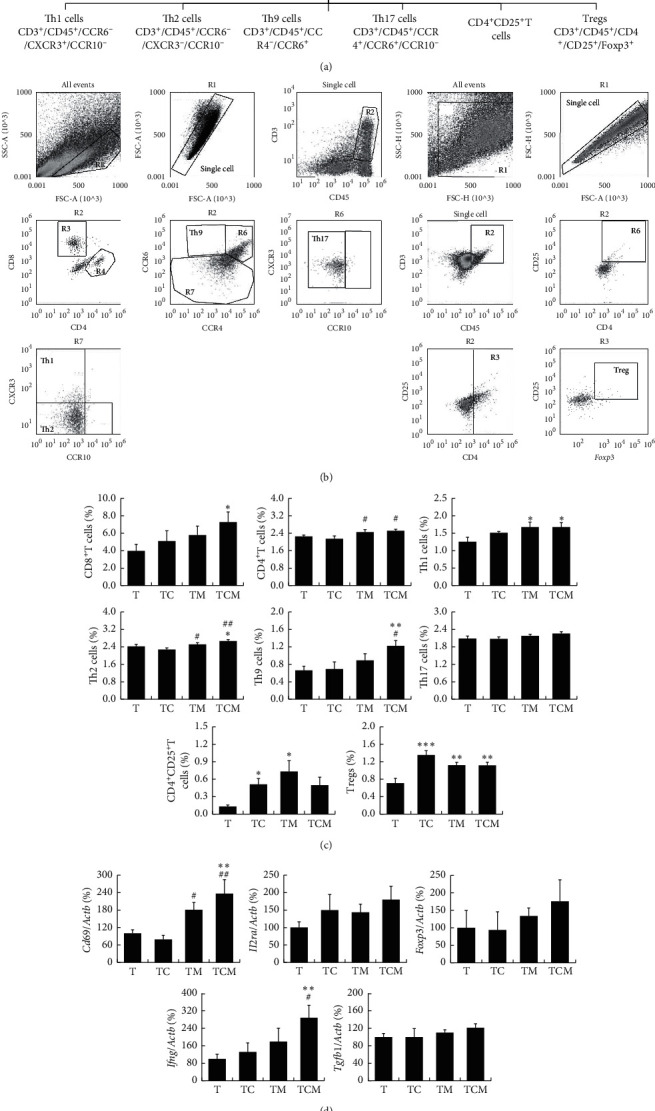
Figure 2.

The effect of combinatorial cisplatin and moxibustion treatment on T lymphocyte subsets in the tumor immune microenvironment. (a) Hierarchy and related markers of T cells. (b) Representative FCM patterns used in the present experiments. T cell subpopulations including CD8+ CTLs, CD4+ T Th1, Th2, Th9, Th17, CD4+CD25+T cells, and Tregs (R3-CD8+ CTLs and R4-CD4+ T cells) detected in the current study. (c) Quantification of T cell subset proportions in the tumor site of LLC-bearing mice in indicated treatment groups (n = 7). (d) The expression of T cell-related genes including Cd69, Il2ra, Foxp3, Ifng, and Tgfb1 (n = 6). Data are mean ± SEM. With the exception of CD8+ CTLs, the data of other cell subsets are represented by the log value used as statistics. ∗P < 0.05, ∗∗P < 0.01, and ∗∗∗P < 0.001vs. T; #P < 0.05 and ##P < 0.01vs. TC.
