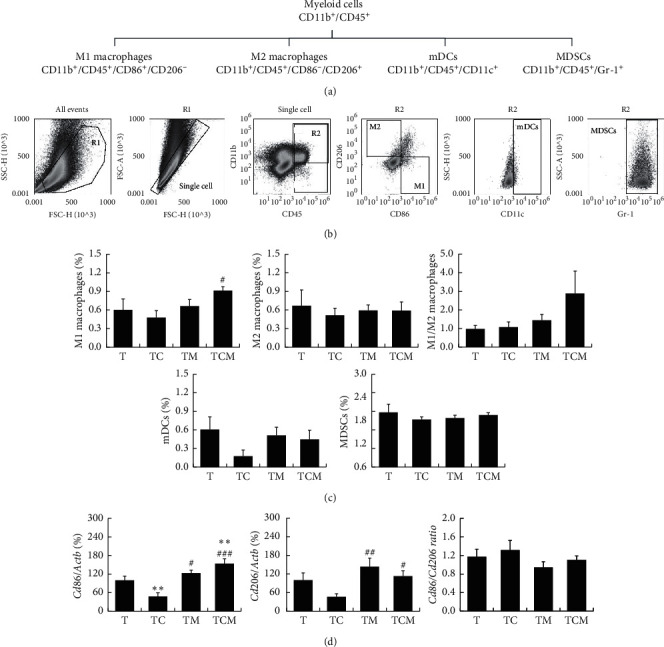
Figure 3.

The effect of combinatorial cisplatin and moxibustion treatment on myeloid cell subsets in the tumor immune microenvironment. (a) Hierarchy and related markers of myeloid cell subsets. (b) Representative FCM patterns used in the experiments. Myeloid cell subpopulations included M1 macrophages, M2 macrophages, mDCs, and MDSCs. (c) Quantification of myeloid cell subset proportions in the tumor site of LLC-bearing mice in indicated treatment groups (n = 7). (d) The gene expression of macrophage-related markers including Cd86, Cd206, and the Cd86/Cd206 ratio (n = 6). Data are mean ± SEM by the log value used as statistics. ∗P < 0.05 and ∗∗P < 0.01vs. T; #P < 0.05, ##P < 0.01, and ###P < 0.001vs. TC.
