Figure 4.

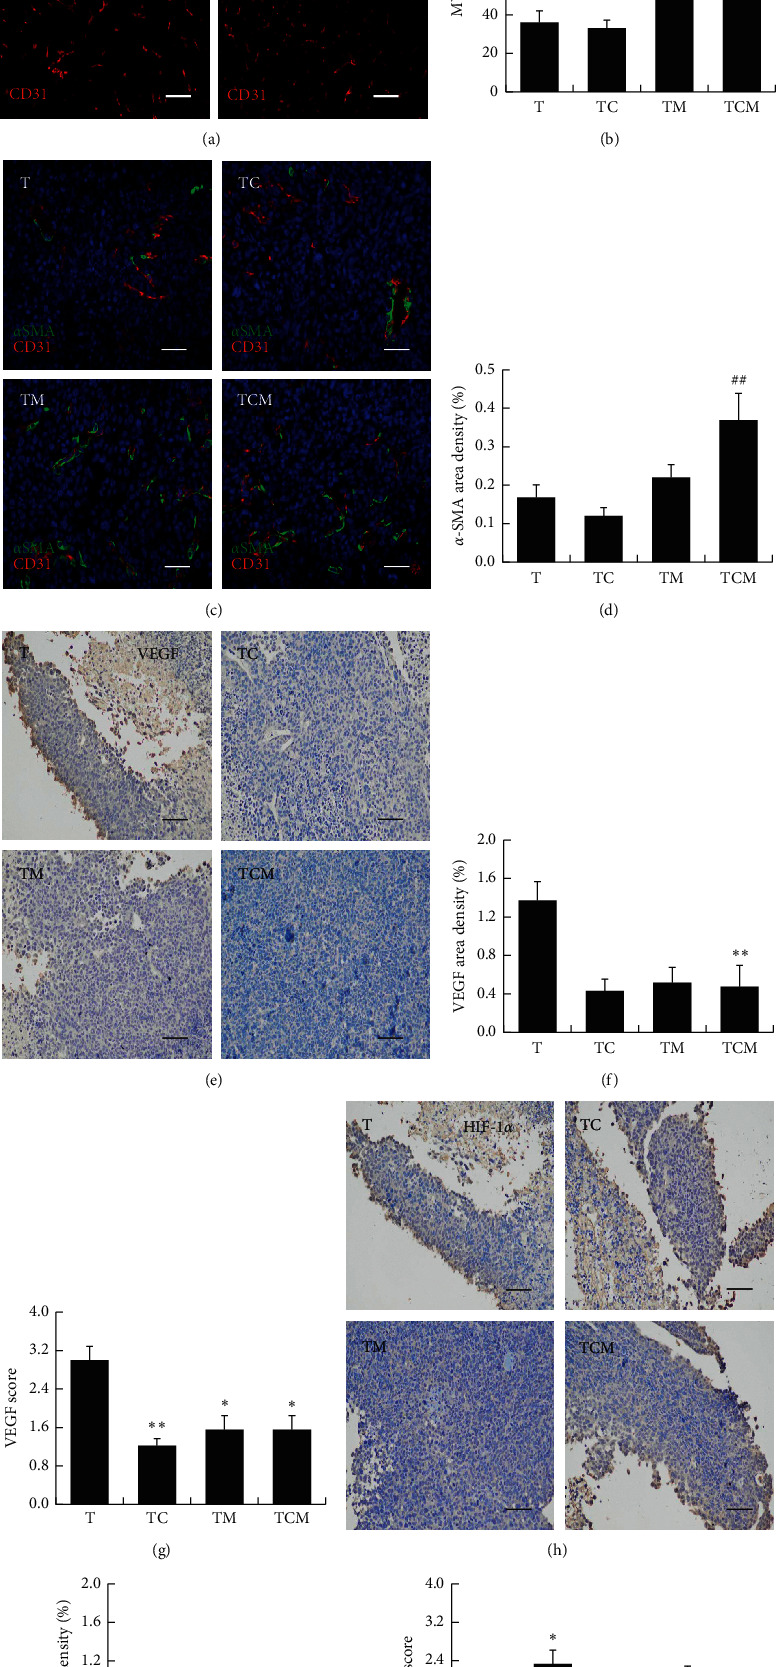
The effects of combinatorial cisplatin and moxibustion treatment on tumor vascular normalization. (a) Representative images of tumor microvessels showing CD31+ endothelial cells (red). (b) MVD values are shown by histograms representing quantitative image analysis of the immunofluorescence intensity in CD31+ endothelial cells (n = 3). (c) Representative images of the simultaneous immunodetection of endothelial cells (CD31, red), pericytes (SMA-α, green), and nuclei (DAPI, blue). (d) α-SMA area density showing pericyte coverage immunofluorescence intensity in α-SMA + pericytes (n = 3). Data in (b) and (d) are mean ± SEM, ##P < 0.01vs. TC. (e) Representative immunohistochemical staining for VEGF. (f-g) The semiquantification of VEGF expression is shown in (f) the area density of VEGF and (g) the VEGF score (n = 3). Data are mean ± SEM, ∗P < 0.05 and ∗∗P < 0.01vs. T. (h) Representative immunohistochemical staining for HIF-1α. (i-j) The semiquantification of HIF-1α expression is shown: (i) The area density of HIF-1α; (j) The HIF-1α score (n = 3). Data are mean ± SEM, ∗P < 0.05vs. T. Scale bars = 50 μm in (a), (c), (e) and (h).
