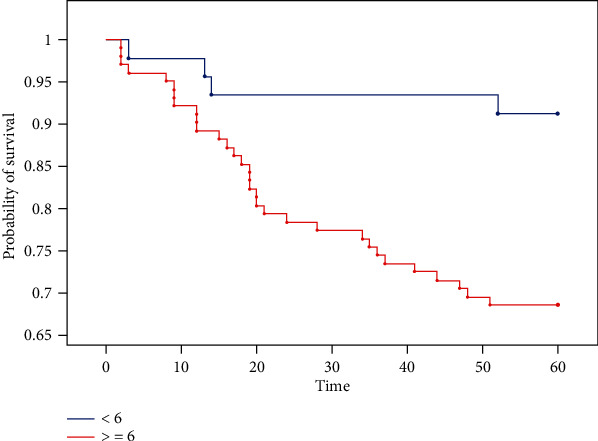
Figure 7.

Kaplan-Meier curves for overall survival in patients with endometrial cancer stratified by SLUG expression. The Kaplan-Meier plots illustrate statistically significant differences (p < 0.05) in the probability of survival in patients with SLUG expression ≥ 6 and <6 (time/months). Logrank chi2 = 8, 2801,df = 1, andp = 0.0040. Wilcoxon-Breslow-Gehanchi2 = 8, 0659,df = 1, andp = 0.0045. Taron-Warechi2 = 8, 1876,df = 1, andp = 0, 0042.
