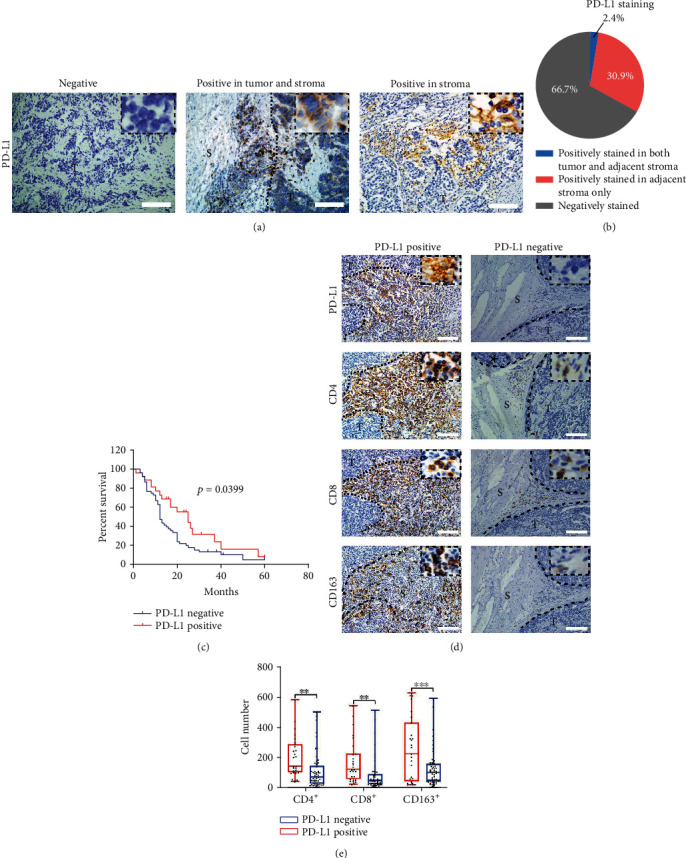
Figure 1.

The expression of PD-L1 in the stroma correlates with tumor-infiltrating immune cells in PESCC. (a) Representative immunohistochemistry (IHC) images showing different expression patterns of PD-L1 in PESCC tissues. Scale bar, 100 μm. S: stroma; T: tumor. (b) Distribution of different expression patterns of PD-L1 are plotted in the pie chart. (c) The Kaplan–Meier survival analysis of overall survival (OS) in a cohort of 77 PESCC patients according to positive (red line, n = 26) and negative (blue line, n = 51) PD-L1 expression. (d) Representative IHC images showing PD-L1, CD4, CD8, and CD163 expression in the stroma using consecutive sections of PD-L1-positive and PD-L1-negative specimens. Scale bar, 100 μm. S: stroma; T: tumor. (e) The presence of PD-L1 is positively associated with the number of CD4+ TILs, CD8+ TILs, and CD163+ TAMs (∗∗p < 0.01 and ∗∗∗p < 0.001 by the Wilcoxon test).
