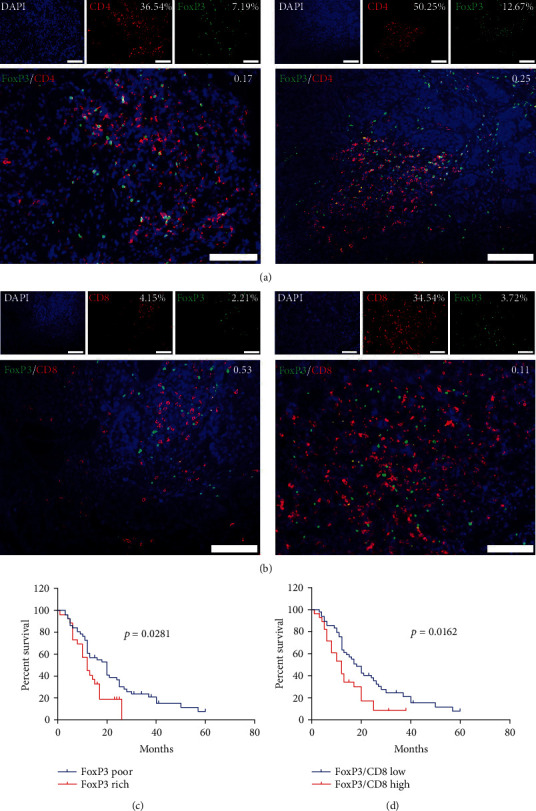
Figure 4.

Expression and prognostic value of FoxP3 in PESCC. (a) Representative multi-IF images of two samples showing FoxP3/CD4 ratios in the stroma. Scale bar, 100 μm. (b) Representative multi-IF images showing two samples with high (left) and low (right) FoxP3/CD8 ratios in stroma. Scale bar, 100 μm. (c) Rich FoxP3 (red line, n = 26) was associated with significantly shorter OS than poor FoxP3 (blue line, n = 51). (d) A high FoxP3/CD8 ratio (red line, n = 28) was associated with shorter OS than a low FoxP3/CD8 ratio (blue line, n = 49).
