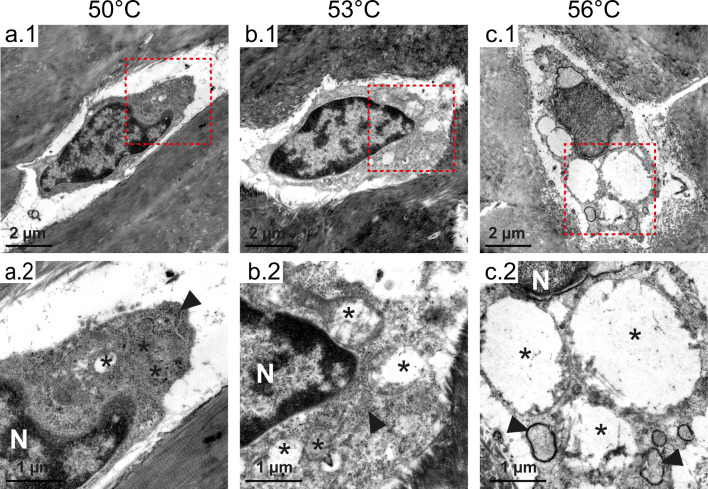
Fig. 6.
Transmission electron microscopy images of osteocytes (rectangle in a–c; 1, indicates the respective magnified area shown a–c; 2. N, nucleus; asterisks, mitochondria; arrowhead, endoplasmic reticulum). With increasing temperature, the osteocytes show typical signs of cellular stress. Beginning at 53 °C, the mitochondria are swollen and lose the structure of their inner cristae. At 56 °C, the lumina of the endoplasmic reticulum are pronouncedly dilated

