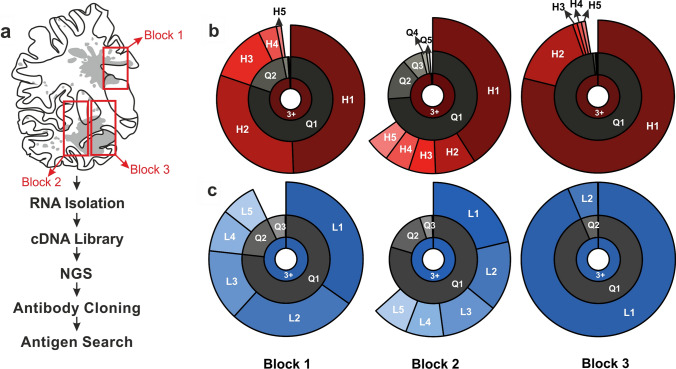
Fig. 2.
Clonal distribution of IgG H- and L-chains in three tissue blocks of patient hAE. a Camera lucida drawing of a large brain sections from the hAE patient with topographical distribution of demyelinated lesions (grey) and of the 3 tissue blocks used (red boxes). The flow chart summarizes the experimental procedures. Clonality plot of H-chain (H, b) and L-chain immunoglobulins (L, c) found in blocks 1 to 3. The result of the repertoire clonality analysis for each region and chain is plotted on a three-layer donut chart. The inner layer includes the frequency of unique nucleotide sequences that arise during the gene rearrangement process for individual chains (clonotypes) that were identified three or more times (“3+”). The middle layer (“quantile”) displays the abundance of top 20% (“Q1”), next 20% (“Q2”) and further 20% (Q3, Q4, Q5) clonotypes. The outer layer displays the individual abundance of top 5 clonotypes

