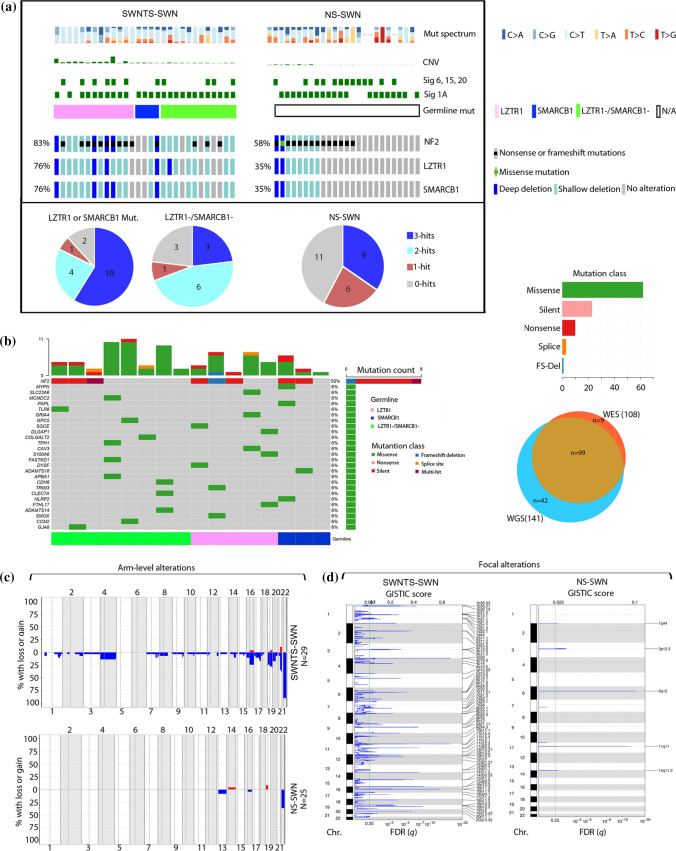
Fig. 2.
Landscape of somatic alterations in SWNTS-SWNs. a Oncoprint showing results from WES analysis of 29 SWNTS-SWNs and 25 NS-SWNs. Mutation spectrum and CNV fraction are plotted on the top. COSMIC signatures 1A, 6, 15, and 20 in each cohort are also depicted. Somatic mutations and deletions in NF2, LZTR1, and SMARCB1 are shown. Distribution of zero, one, two, or three somatic hits across the two cohorts are shown as pie charts below. b Oncoprint showing top deleterious somatic variants (based on SIFT and PolyPhen2) identified by both WES and WGS methods in 16 overlapping samples. Clinical and molecular annotations are depicted above and below the oncoprint. Venn diagram to the right shows the number of variants called by both WES and WGS. c Plots showing compounded arm-level CNV in SWNTS-SWNs versus NS-SWNs. d GISTIC plots showing significant focal deletions in SWNTS-SWNs and NS-SWNs

