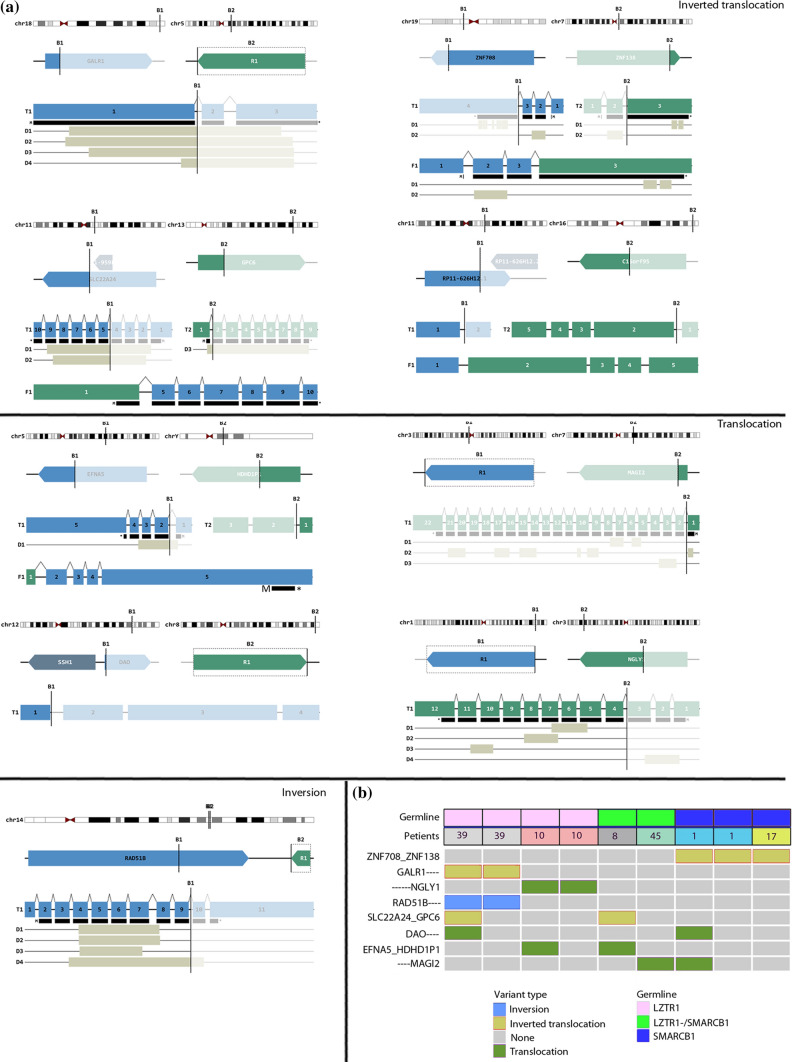
Fig. 3.
Structural variants in SWNTS-SWNs. a Diagrams showing the SVs identified in SWNTS-SWNs using WGS data on 22 tumors. Only recurrent SVs present in at least 2 samples are shown. The breakpoints are given by B1 and B2. The top level depicts the breakpoint positions in each chromosome, the second level down shows breakpoints within the related genes, and the third level shows the transcripts. The predicted fusion product is shown at the bottom. Domains (D) are shown below the transcript and the bar immediately underneath each transcript (labeled with M and *) represents the open reading frame. b Oncoprint shows selected recurrent SVs in at least two samples. Color codes denote germline mutation status and SV type

