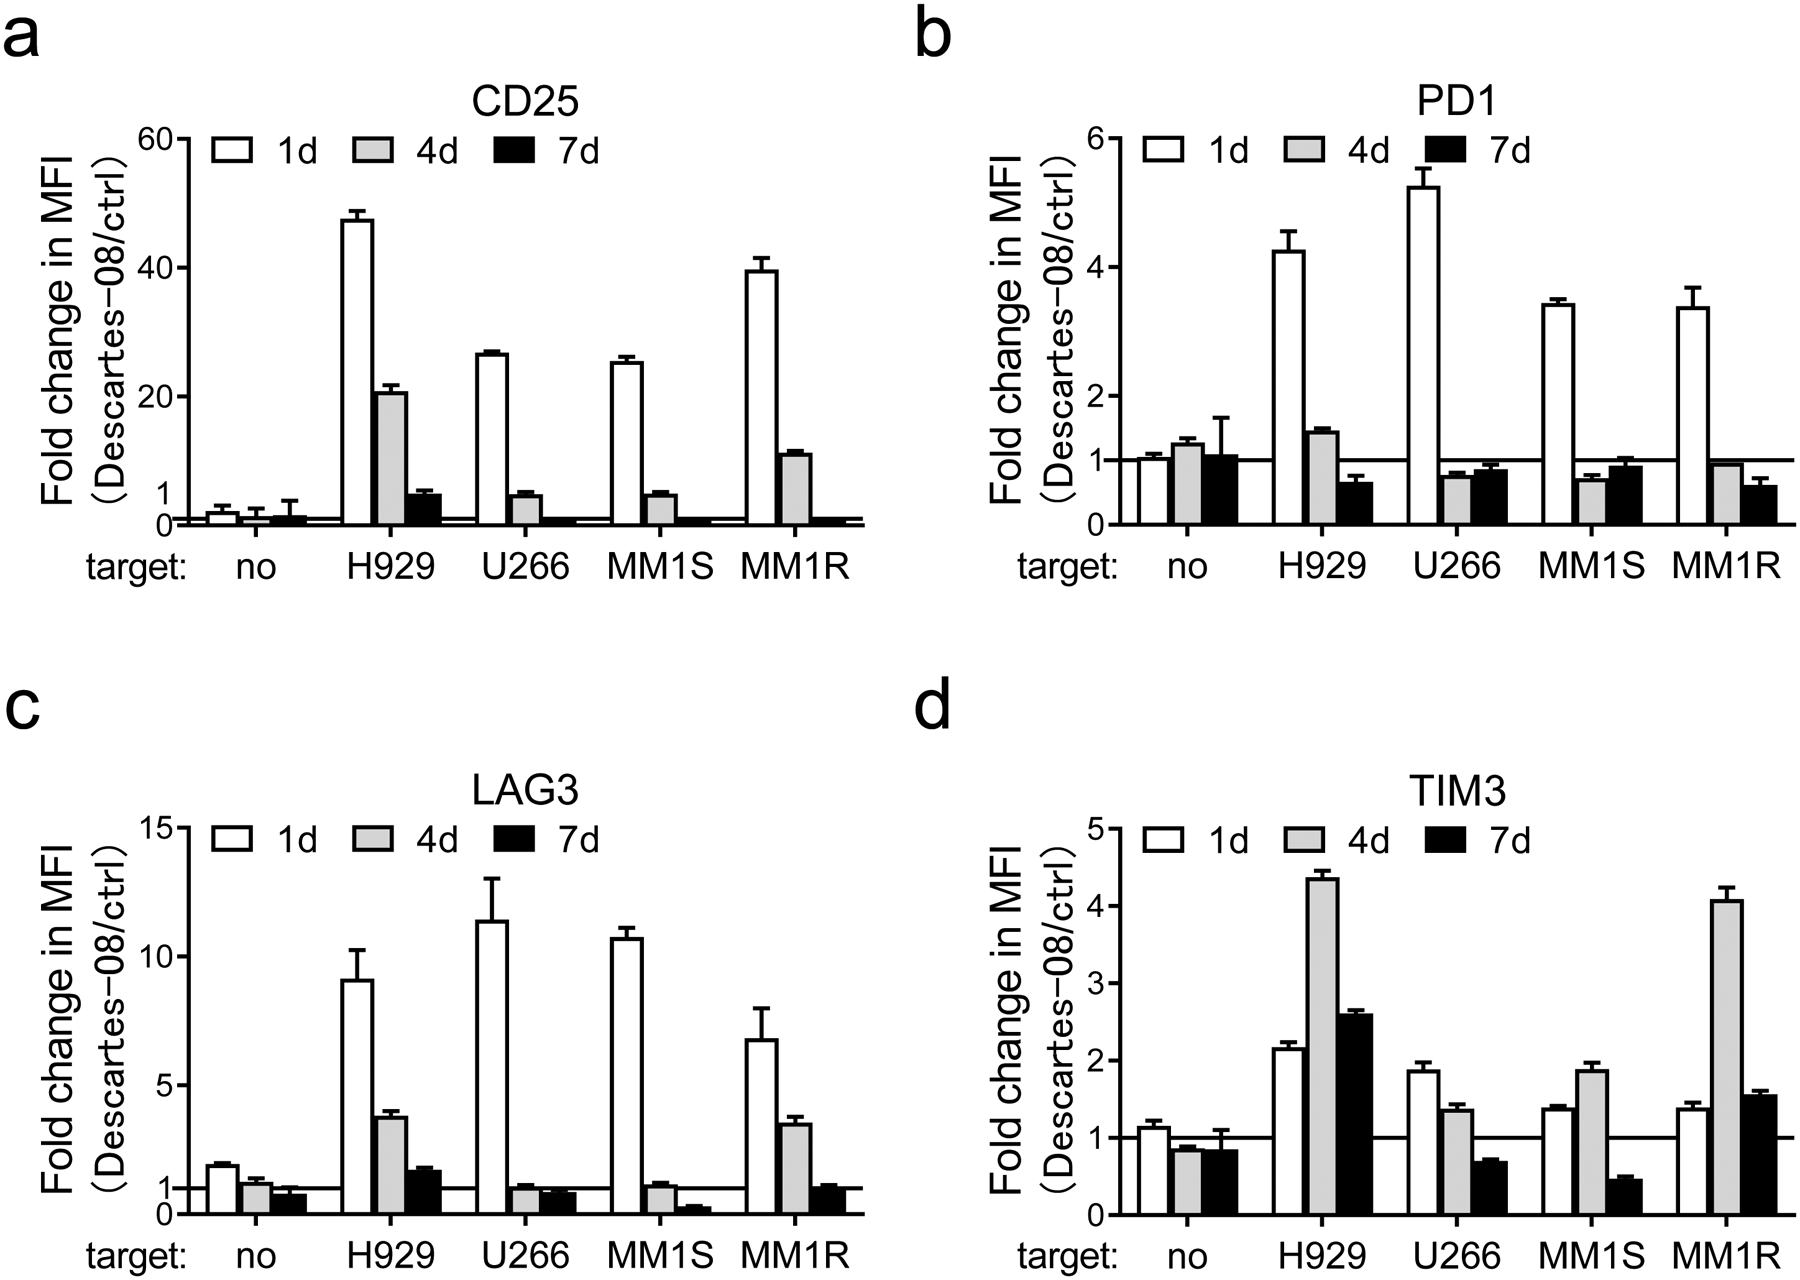
Fig. 3. Descartes-08 T cells showed transient upregulation in T cell activation and checkpoint proteins in a BCMA-selective manner.

a-d Descartes-08 and the paired control (ctrl) CD8+ T cells (n=3) were co-cultured with various target MM cell lines (n=4) (E:T=1:10) or no target MM cells (no). Using FCM analysis, changes in CD25 (a), PD1 (b), LAG3 (c), and TIM3 (d) on T cells were determined by values of median fluorescence intensity (MFI) for the individual protein marker at indicated time periods (1d, 4d, 7d). Fold changes of MFI values of indicated proteins in Descartes-08 vs the paired ctrl T cells were determined by MFI values in Descartes-08 co-incubated with indicated MM cell lines vs those in the paired ctrl T cells co-incubated with the same target cell lines at the same time periods. Three independent experiments were done in triplicates at each condition using T cells from 3 individuals. All data were expressed as means (fold changes) ± SDs.
