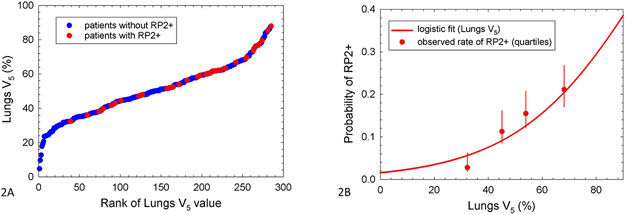
Figure 2:
Association between total lung volume exposed to at least 5 Gy and RP2+. Ranked patient distribution of lungs V5 showing RP2+ cases (2A, left), and logistic model of RP2+ based on lungs V5 (2B, right). In 2A, lungs V5 values for patients with and without RP2+ are shown by red and blue dots, respectively. In 2B, uncertainties are 68% confidence intervals, and observations are plotted at the median value of lungs V5 within the quartiles.

