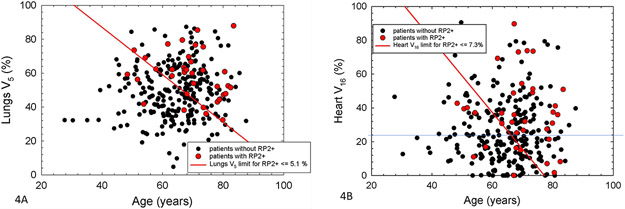
Figure 4:
Scatter plots of patient age and either lungs V5 (4A, left) or heart V16 (4B, right). Values for patients with or without RP2+ are shown by red or black dots, respectively. The red lines show the median value of the multivariate metrics for the relevant Cox models. For patients below and to the left of the red lines, actuarial rates of RP2+ at 1 year are ≤ 5.1 and 7.3 % in 4A and 4B, respectively.

