
Figure 4. RNA expression of CCL5, CCL4, and CCL3 in the CNS of immunocompetent vs. immunocompromised gp120tg mice.
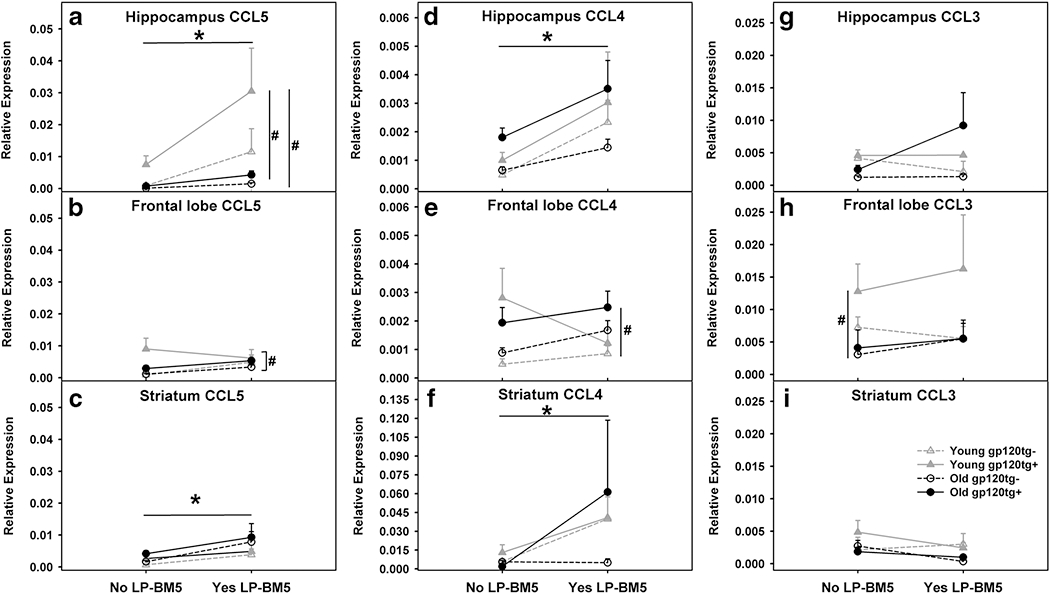
Young (8-10 week old) and old (4-5 months old) gp120tg+ and gp120tg− mice were euthanized at 12 weeks post-LP-BM5 treatment (5xl04 pfu, i.p.). RNA expression of CCL5 (A-C), CCL4 (D-F), and CCL3 (G-I) in the hippocampus (A, D and G), frontal lobe (B, E and H) and striatum (C, F, and I) are shown in interaction plots. Data are presented as mean ± SEM; n=7-16/group. Two-way ANOVA followed by Tukey post hoc test were performed. * indicates the main effect of LP-BM5 (p<0.05). # p<0.05 between the indicated groups regardless of LP-BM5 treatment.