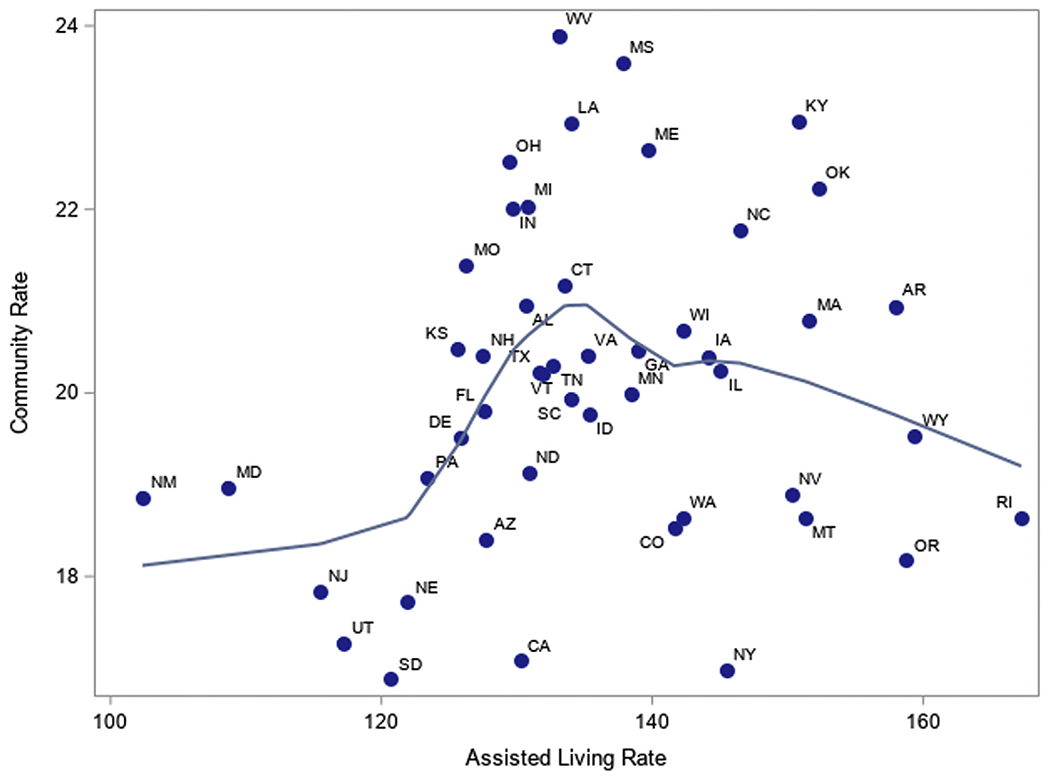
Fig. 2.

Adjusted* rate of ED visits among all community residing Medicare beneficiaries per 100 person-years compared with AL residents. *Rates adjusted for age, race, sex, dual-eligibility, and chronic conditions. Data come from the 2016 and 2017 Medicare Master Beneficiary Summary File and Chronic Conditions, the inpatient Medicare Provider Analysis and Review, and the Medicare outpatient claims. The line represents a loess regression curve that best fits the data.
