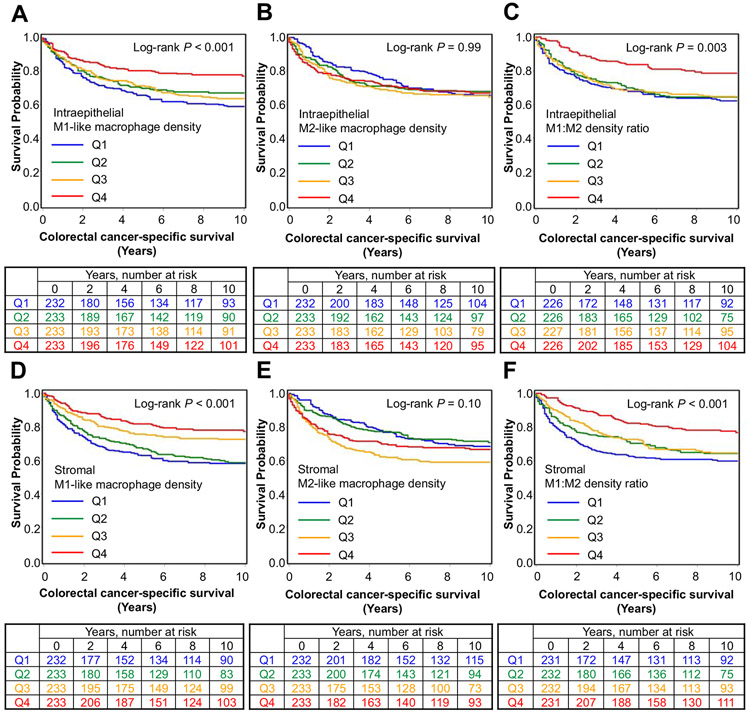
Figure 2.
Inverse probability weighting-adjusted Kaplan-Meier survival curves of colorectal cancer-specific survival and corresponding number at risk tables according to the intraepithelial (A-C) and stromal (D-F) densities of M1-like and M2-like macrophages and M1:M2 density ratio. P values were calculated using the log-rank test.

