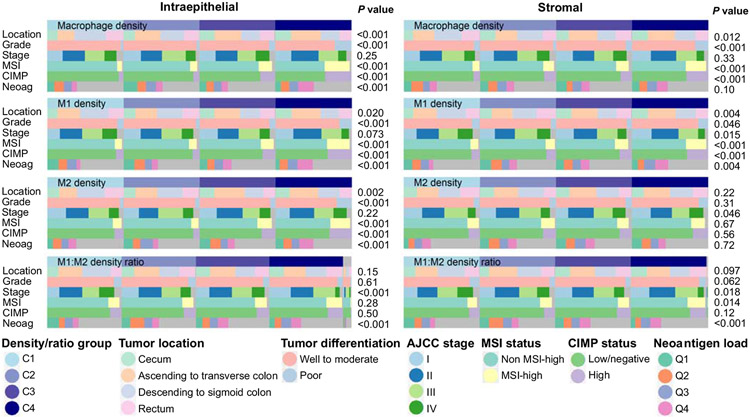
Figure 3.
Heatmap depicting relationships between clinicopathologic features and macrophage densities in tumor intraepithelial region and tumor stroma. The plots show the distribution of clinicopathologic features according to ordinal categories (C1-C4) of macrophage densities. P values are based on the comparison of categorical data between the ordinal categories of macrophage density/ratio using the Chi-square test. Abbreviations: AJCC, American Joint Committee on Cancer; CIMP, CpG island methylator phenotype; MSI, microsatellite instability.

