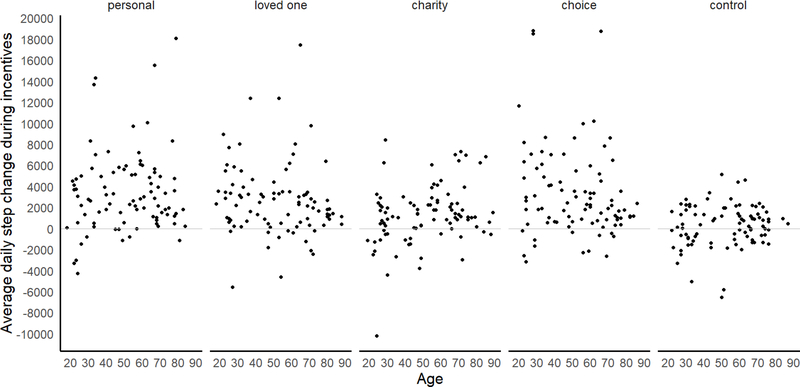
Figure 2.
Scatterplot depicting effects of age and condition on step count change while incentives were in place (N = 450). Each point represents one participant. For ease of interpretation, change scores were calculated by subtracting average daily step counts during the incentivized week from baseline counts.

