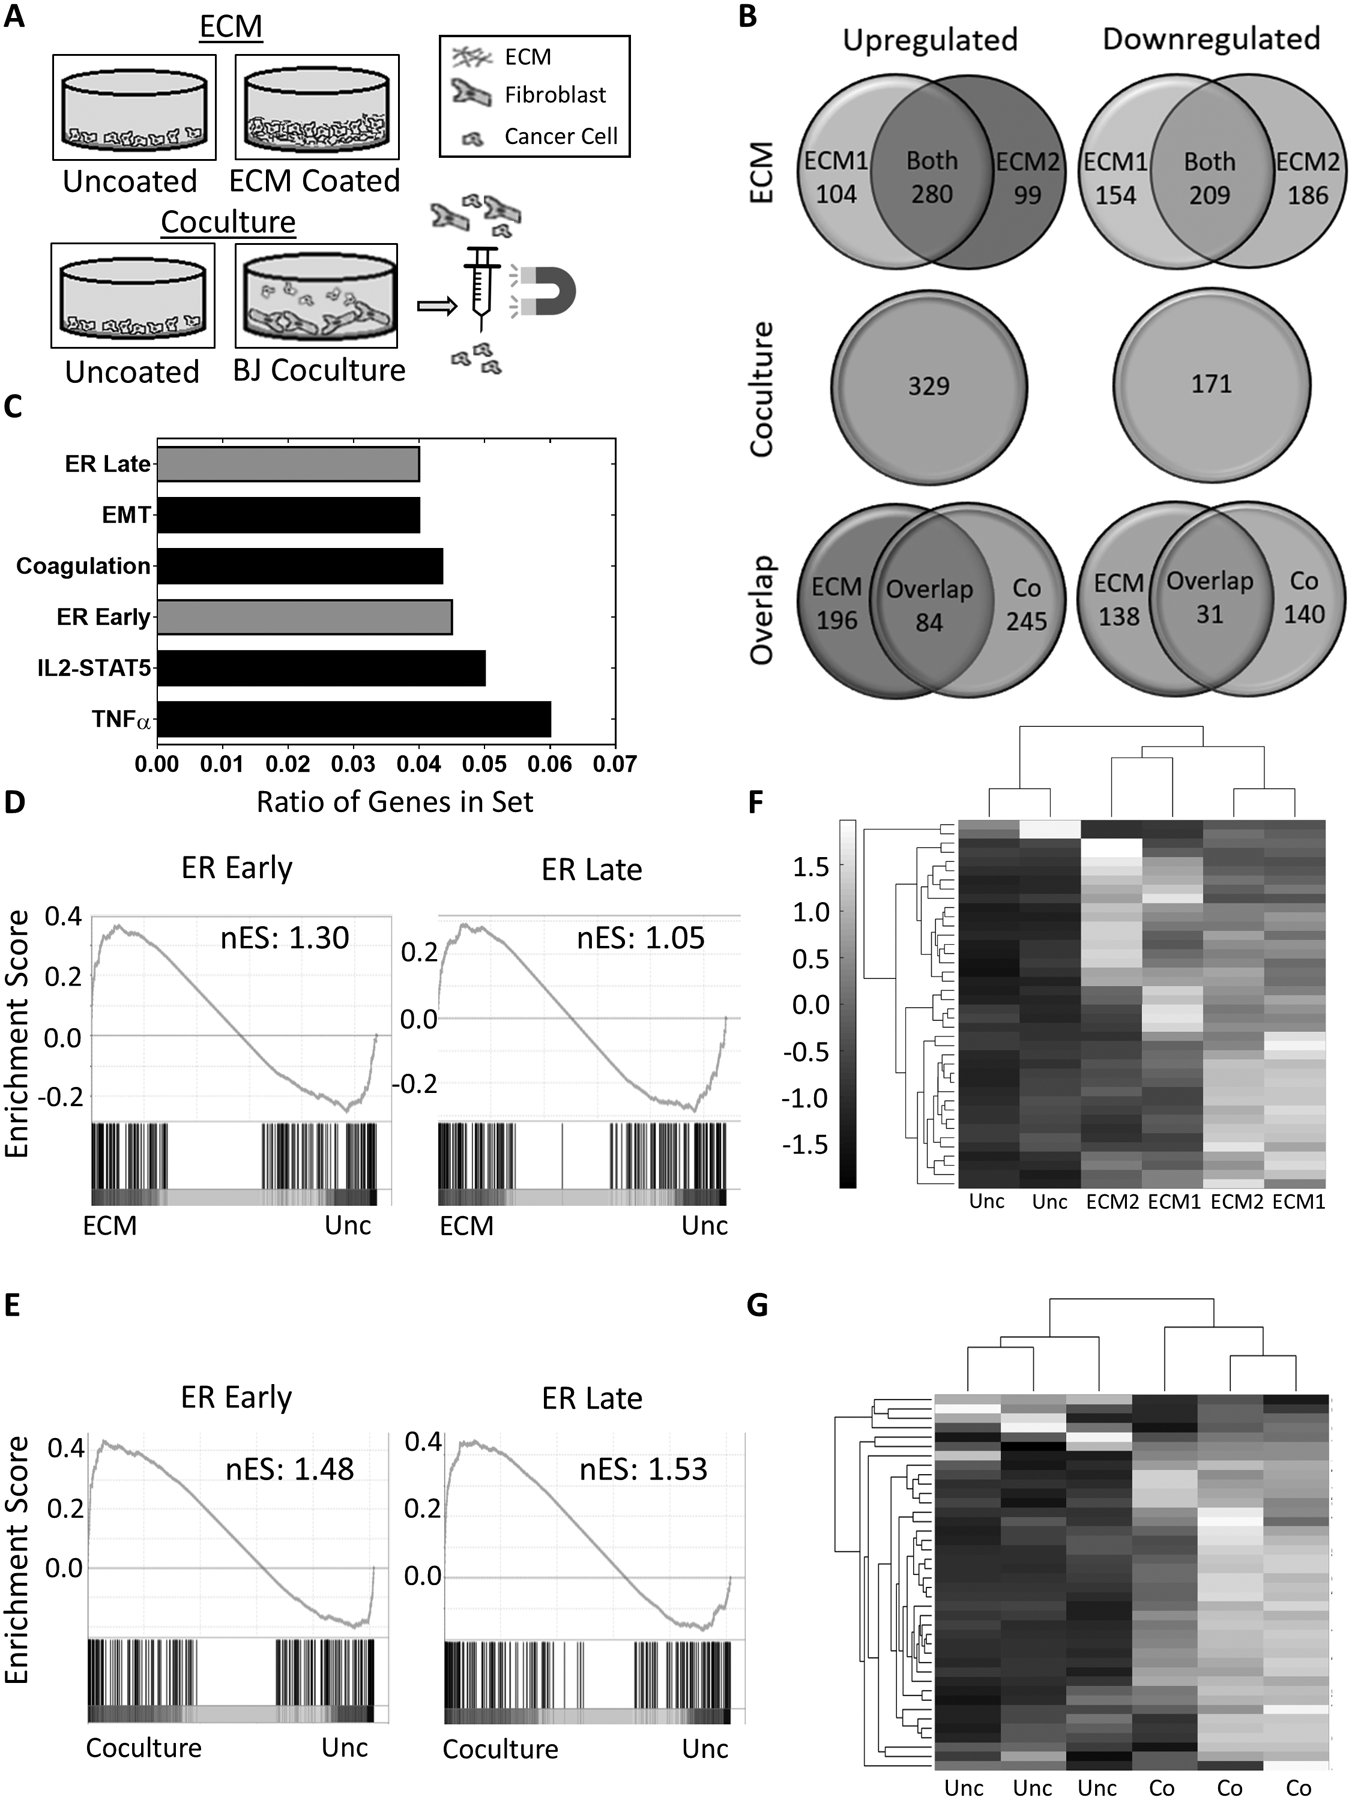
Figure 2. ECM matrices induce estrogen signaling pathways in breast cancer cells.

A, Schematic of the mRNA sequencing experiments. MCF7 cells were cultured in two setups: MCF7 cells cultured 1) on uncoated surfaces or ECM from BJ (ECM1) or IMR90 (ECM2) fibroblasts and 2) alone or in coculture with BJ fibroblasts before isolation by magnetically activated cell sorting. B, Venn Diagram of genes significantly (p<0.05) upregulated (left side) or downregulated (right side) by at least 2-fold in MCF7 cells cultured in either ECM scaffolds derived from BJ (ECM1) or IMR90 (ECM2) fibroblasts, or in BJ fibroblast coculture (Co) compared to cells on uncoated surfaces. C, Hallmark gene sets with highest ratios of genes (k/K) overlapping with the 84 upregulated genes shared between the ECM and coculture sets. D and E, Gene set enrichment analysis (GSEA) of Hallmark Late or Early estrogen response gene sets using mRNA sequencing data of MCF7 cells plated on ECM (D) or cocultured with BJ fibroblasts (E) with nominal enrichment score (nES). Nominal p-value <0.02 for Early (D) and <0.01 for Early (E) and Late (E). F and G, Clustergram of the gene expression of 40 ER-regulated genes in MCF7 cells from the ECM set (F) or the coculture set (G). Data is standardized by each row to a mean of zero and a standard deviation of 1. A list of the genes corresponding to each row can be found in Supplementary Table 3.
