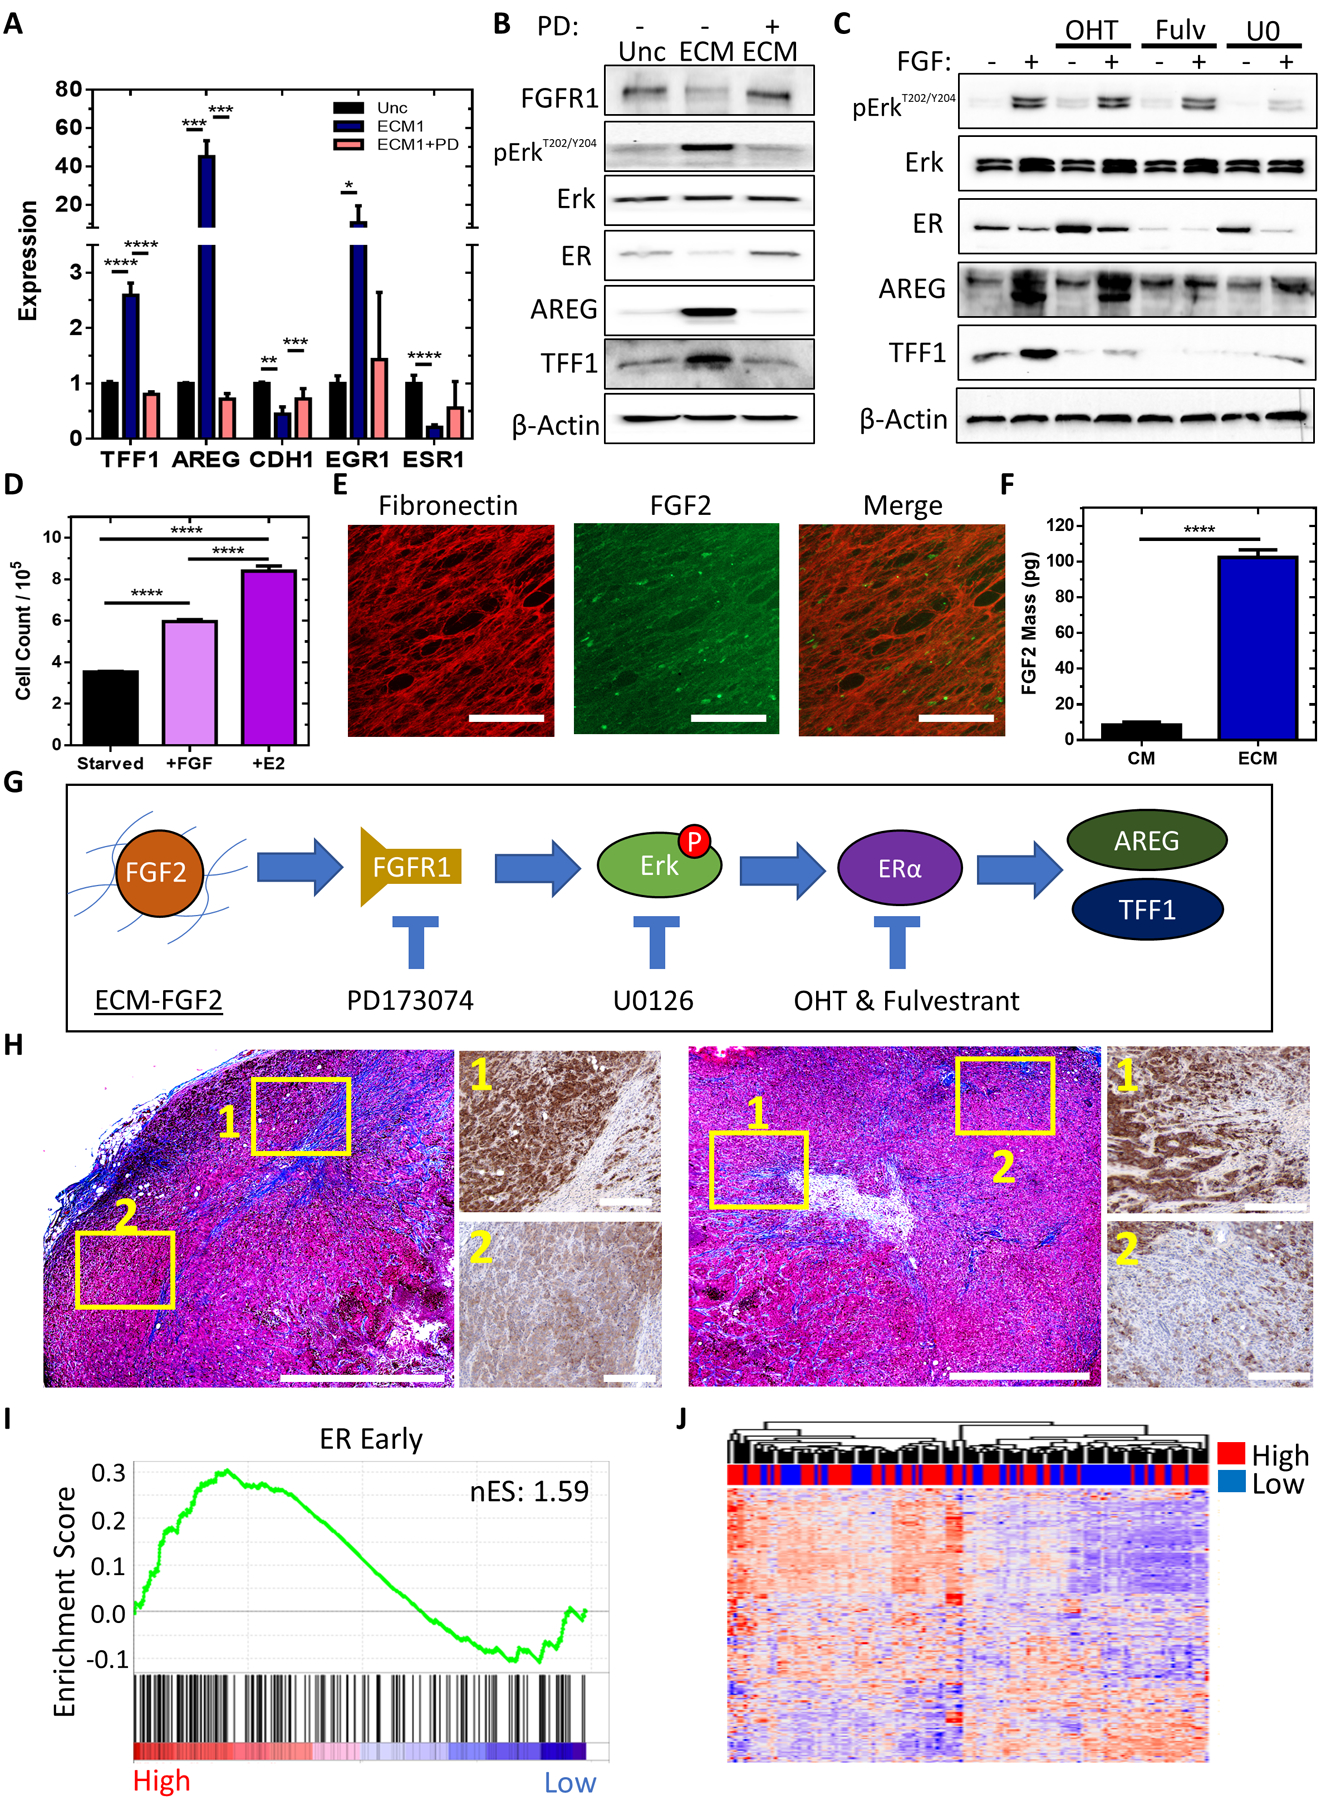
Figure 6. ECM-FGF2 complexes promote estrogen-like signaling in ER+ breast cancer cells.

A, qPCR results for the quantification of mRNA expression of TFF1, AREG, CDH1, EGR1, and ESR1 in MCF7 cells plated onto uncoated surfaces or ECM scaffolds derived and treated with vehicle or 1 μM PD173074 for 24 hours. n = 6 from N = 2 independent experiments. One-way ANOVA with Bonferonni post-test of log-transformed fold change within each gene. **** P<0.0001, *** P<0.001, ** P<0.01, * P<0.05. B, Immunoblot performed using protein lysates from MCF7 cells cultured on uncoated surfaces or ECM and treated with vehicle or 1 μM PD173074 for 24 hours to detect Erk, Erk phosphorylation, AREG, TFF1, β-actin, FGFR1, and ER protein expression. C, Immunoblot performed using protein lysates from MCF7 cells treated with or without 40 ng/mL FGF-2 and with or without 1 μM of OHT, 1 μM of fulvestrant, or 30 μM of U0126 for 24 hours to detect Erk, Erk phosphorylation, AREG, TFF1, β-actin, and ER protein expression. D, Total cell count of MCF7 cells cultured in estrogen-deprived medium for 3 days then treated with 1 nM E2 or 40 ng/mL FGF-2 for 3 days. n = 3. One-way ANOVA with Bonferonni post-test. E, Immunofluorescent images of decellularized ECM labeled with fibronectin (red) or FGF2 (green) antibodies. Scale bar = 100 μm. F, ELISA data for the mass of FGF2 bound to ECM in a 96-wellplate versus the mass of soluble FGF2 in fibroblast-conditioned media (CM) of the fibroblasts that generated the ECM. n = 3 wells per condition. Unpaired t-test. G, Proposed mechanism. H, Masson’s trichrome stain and TFF1 immunohistochemistry stains of MCF7 xenograft tumors. Trichrome stain bars 1000 μm. IHC bars 200 μm. I, GSEA of the Hallmark estrogen response early set using extratumoral biopsies from 120 patients with breast cancer stratified by <25% mammographic breast density (MBD) (Low, N=56) or >=25% MBD (High, N=64) with nES. Nominal p-value <0.01. J,Heatmap of expression of the Hallmark estrogen response early gene set in extratumoral regions of 120 patients with breast cancer annotated by low or high MBD. Complete clustergram provided in Supplementary Figure 6.
