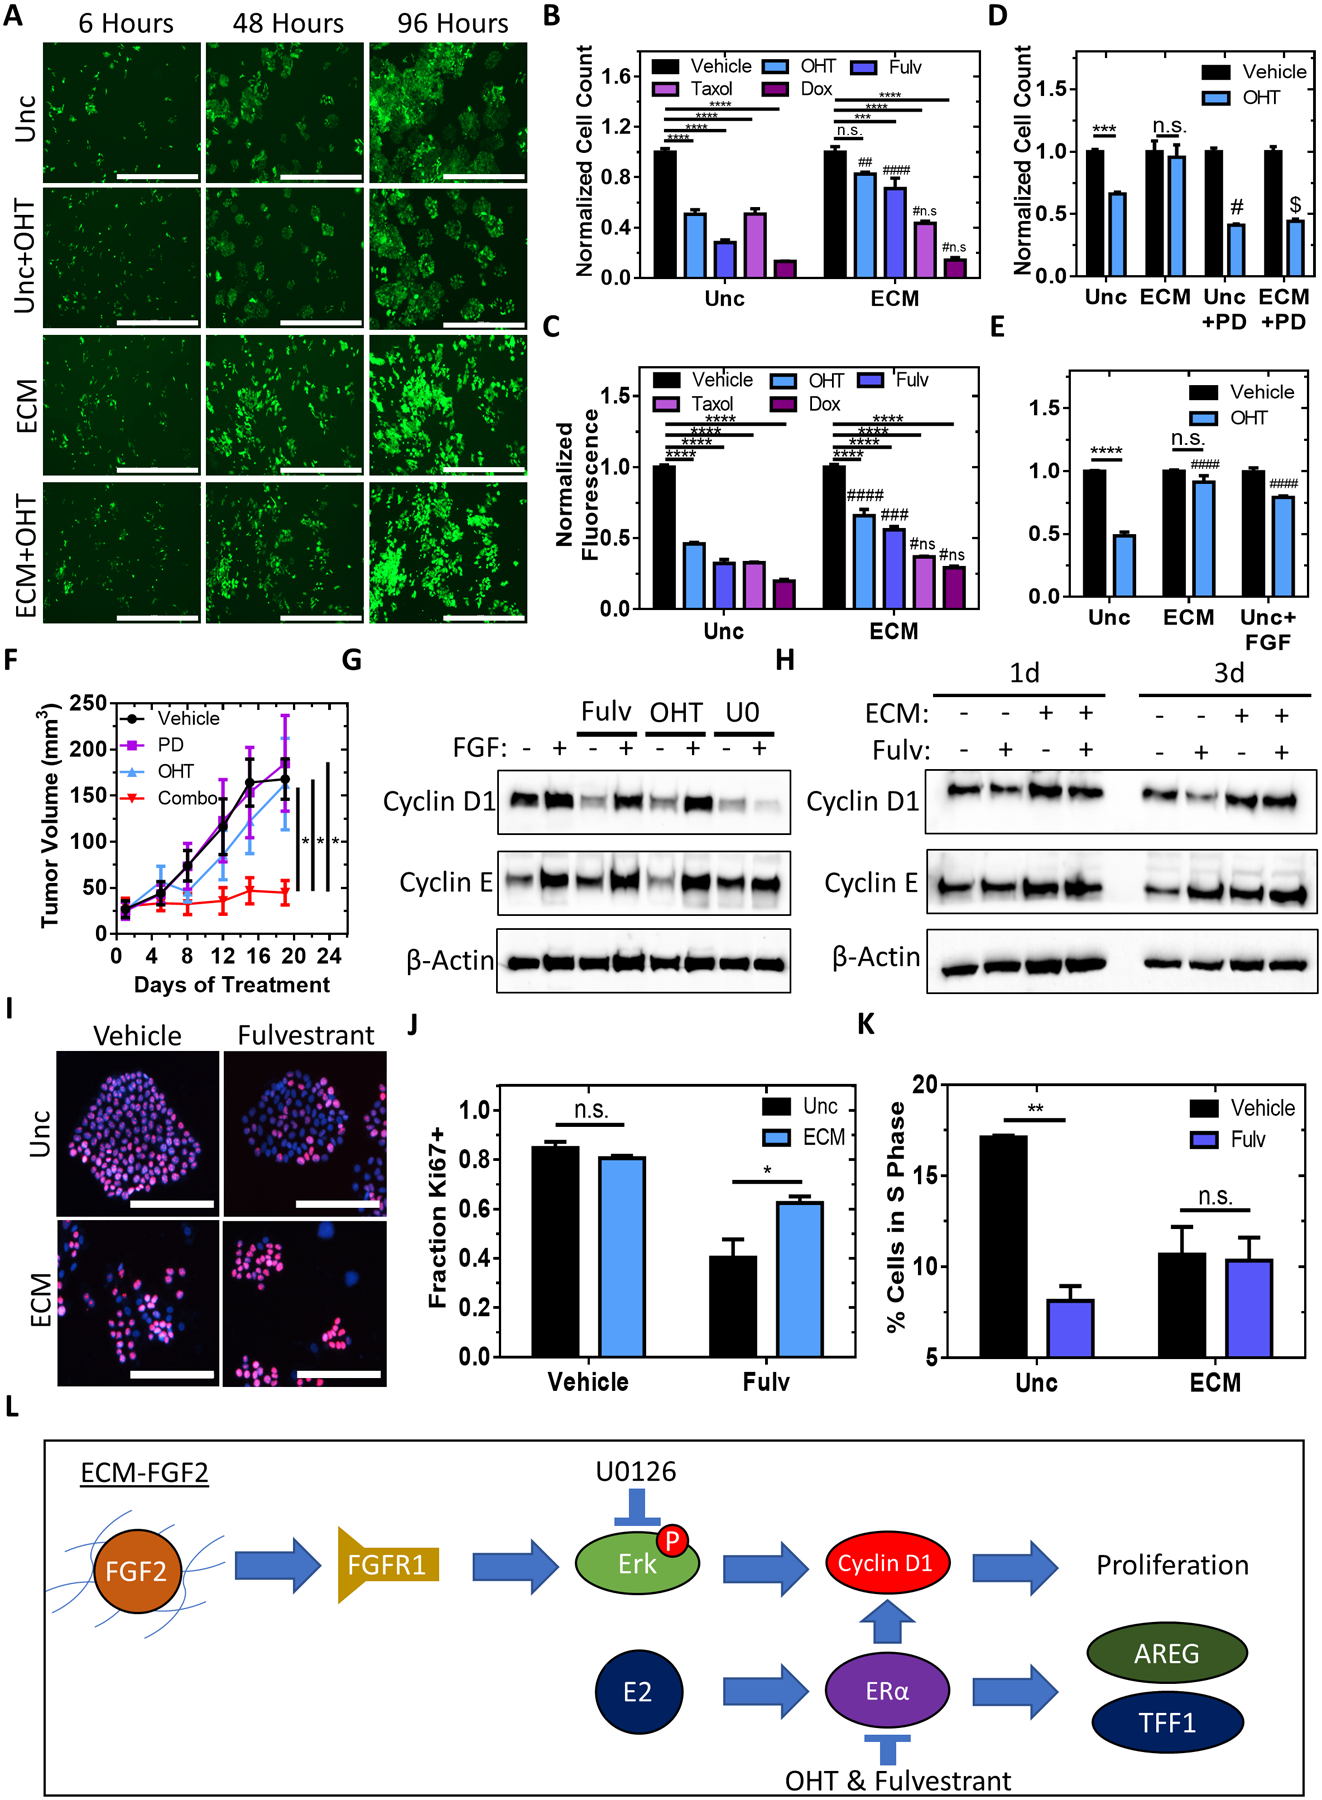
Figure 7. ECM signaling reduces anti-estrogen sensitivity of ER+ breast cancer cells via G1 arrest prevention.

A, Representative time-lapse images of GFP-expressing MCF7 cells plated onto uncoated surfaces or ECM scaffolds with or without 1 μM OHT for 96 hours. Scale bar = 1000 μm. B, Normalized cell count of MCF7 cells treated for 4 days with 1 μM OHT, 1 μM fulvestrant, 100 nM doxorubicin, or 3 days with 5 nM taxol on uncoated surfaces or ECM scaffolds. n = 3–6 per condition from N = 1–2 independent experiments. Two-way ANOVA with Bonferonni post-test. **** P<0.0001, *** P<0.001, #### P<0.0001 compared to the same treatment with uncoated, ## P<0.01 compared to the same treatment with uncoated, #n.s. P >0.05 compared to the same treatment with uncoated. C, Normalized fluorescence of viability reagent after exposure to MCF7 cells plated on uncoated surfaces or ECM scaffolds treated for 4 days with 1 μM OHT, 1 μM fulvestrant, 2.5 nM taxol, or 100 nM doxorubicin. n=3–6. Two-way ANOVA with Bonferonni post-test. ### P <0.001 compared to the same treatment with uncoated. D and E, Normalized cell counts of MCF7 cells treated for 4 days with vehicle, 1 μM OHT, 1 μM OHT and 40 ng/mL FGF (D), or 1 μM OHT and 1 μM PD173074 (E) on uncoated surfaces or ECM scaffolds. n = 6 from N = 2 independent experiments. Two-way ANOVA with Bonferonni post-test, # P<0.05 compared to the same treatment with uncoated, $ P<0.0001 compared to the same treatment with ECM. F, Measurements of tumor volume of mice inoculated with MCF7 cells and treated with vehicle, PD173074, OHT, or a combination of both. n = 4–5 mice per condition. One-way ANOVA. * P<0.05. G, Immunoblot performed using protein lysates from MCF7 cells treated with or without 40 ng/mL FGF-2 and treated with 1 μM of OHT, 1 μM of fulvestrant, or 30 μM of U0126 for 72 hours to detect Cyclin D1, Cyclin E, and β-actin protein expression. H, Immunoblot performed using protein lysates from MCF7 cells cultured on uncoated surfaces or ECM scaffolds and treated with or without 1 μM of fulvestrant for 24 or 72 hours to detect Cyclin D1, Cyclin E, and β-actin protein expression. I, Representative images of Ki67- and DAPI-stained MCF7 cells plated onto uncoated surfaces or ECM scaffolds with or without 1 μM fulvestrant for 96 hours. Scale bar = 200 μm. J, Fraction of MCF7 cells positive for Ki67 on ECM scaffolds or uncoated surfaces after treatment with or without 1 μM fulvestrant for 96 hours. n = 2–3 wells per condition with total cell counts ranging from 905–6888 cells. Two-way ANOVA with Bonferonni post-test. K, Percentage of cells in S-phase after cell cycle analysis using propidium iodide staining of MCF7 cells on uncoated surfaces or ECM-scaffolds treated with or without 1 μM fulvestrant for 48 hours. N = 2 independent experiments with n = 8776–11674 cells per condition. Unpaired t-test. ** P < 0.01. L, Proposed mechanism.
