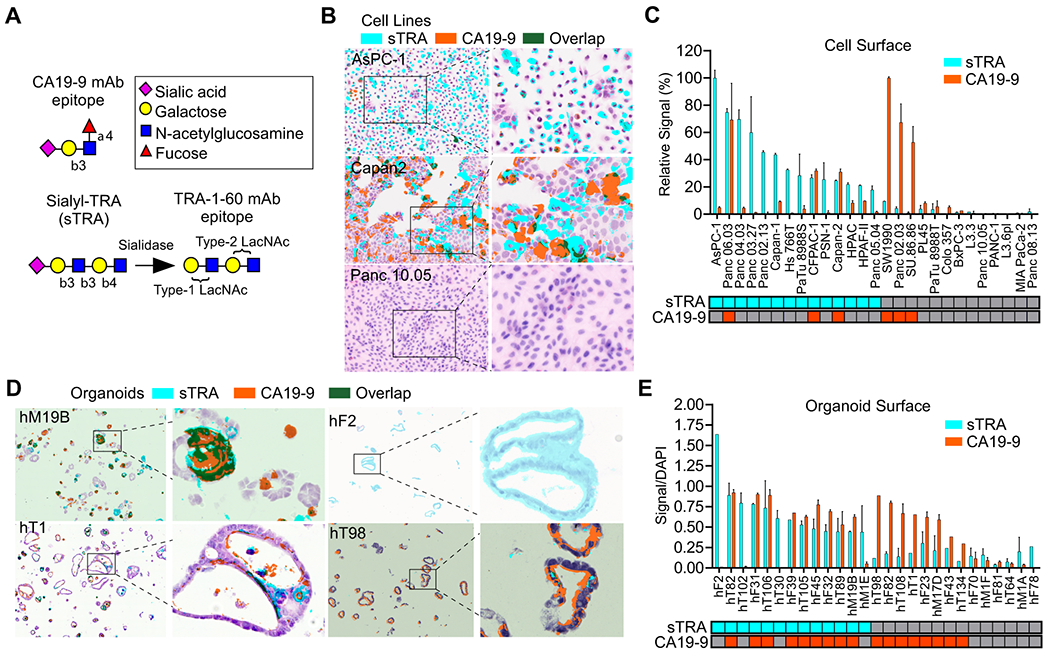
Figure 1. Complementary glycan expression in model systems.

A) Glycan structures. B) Diverse sTRA and CA19-9 expression in cell culture. C) Cell-surface expression of 27 cell lines. The classification of positivity at the bottom was based on a cutoff of signal-to-noise ratio > 3. D) Diverse glycan expression in organoid models. E) Cell-surface glycan expression of 27 organoid models. The classification of positivity at the bottom used cutoffs that optimized the discrimination between background signal and true marker expression. The magnification was 20X for the non-zoomed images.
