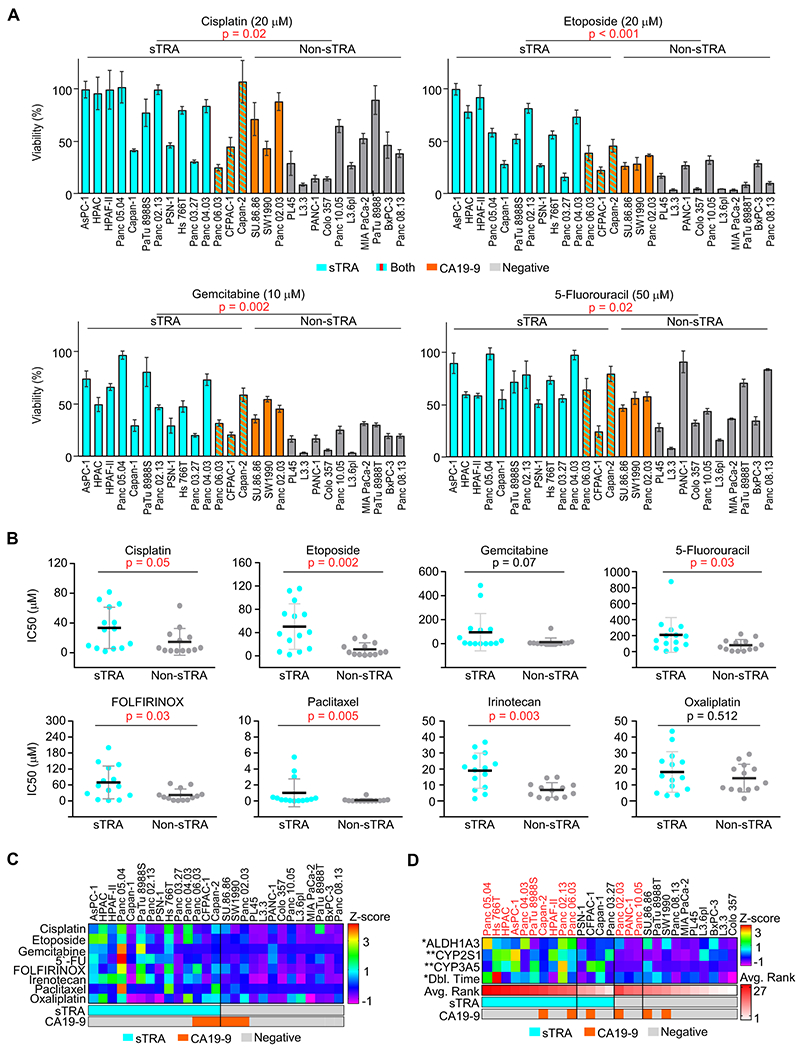
Figure 3. Drug resistance differences between glycan-defined types.

A) Single-dose viability in the panel of 27 cell lines. B) IC50 values calculated from dose-response curves, grouped by marker group. P Values were calculated by Mann–Whitney test. C) Summarized IC50 values for all drugs and cell lines. Z-scores were used to normalize the scales of the IC50 values for comparisons. D) Factors and markers associated with resistance. Z-scores were used to normalize the gene-expression data and the doubling times. Avg. Rank is the average across drugs of the ranks in IC50 of each cell line among the panel of 27.
