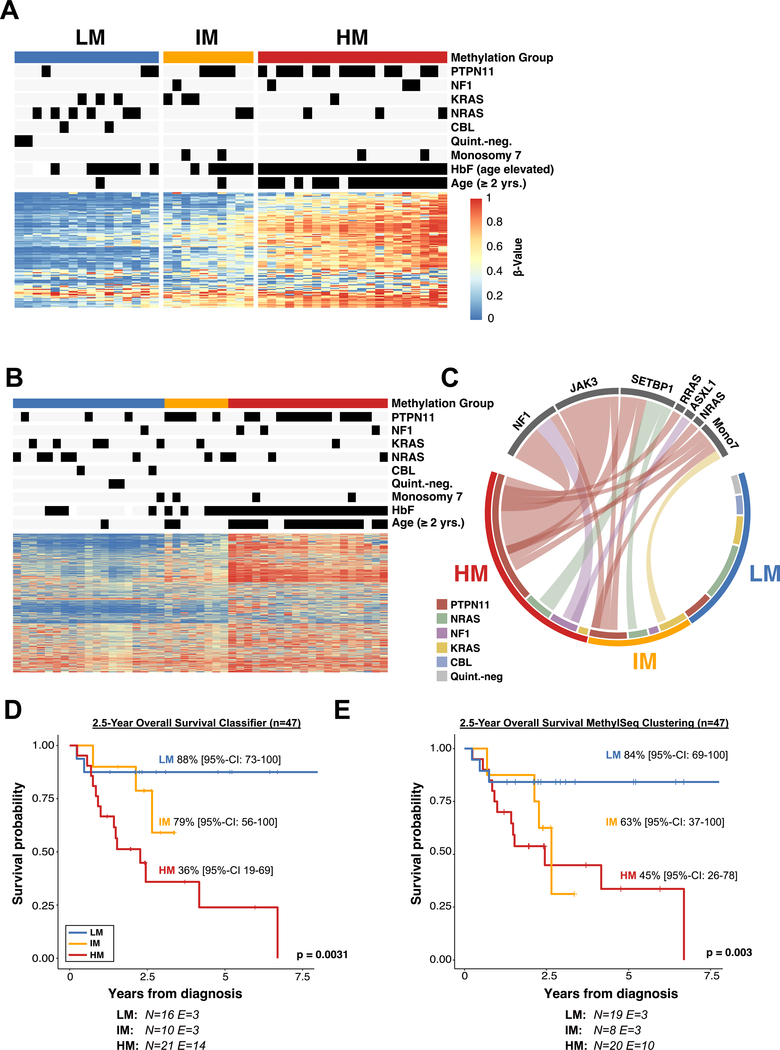
Figure 4 |. Validation of the DNA methylation classifier in an independent patient cohort.
(A) Heatmap showing the DNA methylation beta-values of the 124 model CpG sites for an independent validation cohort (n = 47). Methylation subgroups were assigned by classifier predictions. (B) Determination of the DNA methylation subgroups using targeted amplicon-bisulfite sequencing (MethylSeq). Patients were clustered using hierarchical clustering with Ward’s method. (C) Circos plot displaying the association between known driver mutations and secondary mutations in the three DNA methylation subgroups as determined by the 124 CpG machine learning classifier. (D+E) Kaplan-Meier curves showing the overall survival of JMML patients stratified by DNA methylation subgroups. DNA methylation subgroups were assigned based on the JMML methylation classifier (D) or MethylSeq clustering (E). Probabilities and confidence intervals are indicated for each DNA methylation subgroup. The number of individuals at risk (N) and the number of events (E) is depicted at the bottom. Statistical significance was calculated using log-rank test.

