Figure 3.
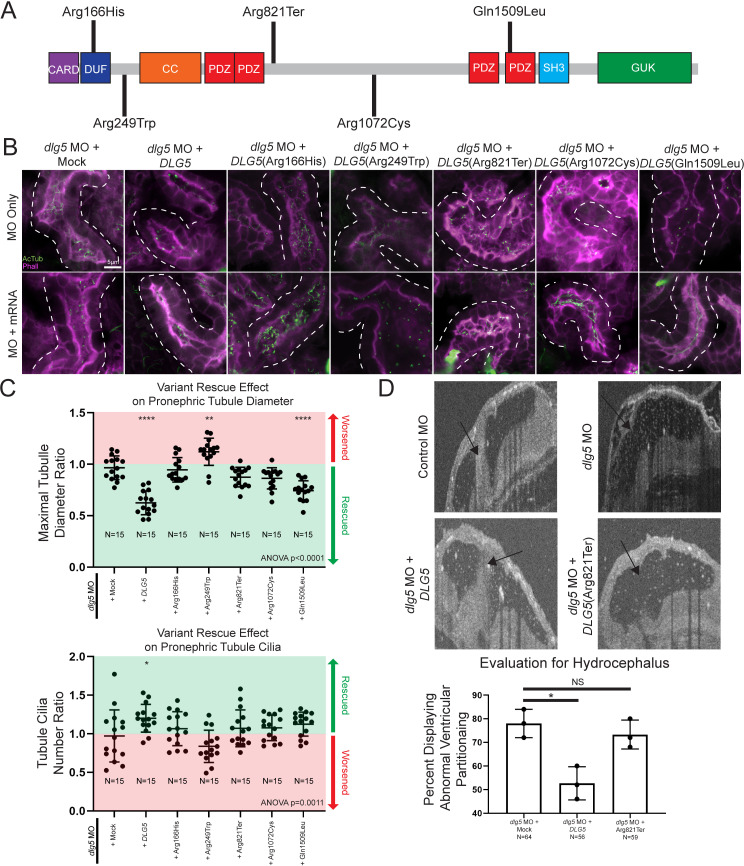
Xenopus model of discs large 5 (dlg5) loss of function provides a platform for testing variant pathogenicity. (A) Schematic diagram of DLG5 protein with domain annotations and locations and effects of uncovered patient variants. CARD, caspase activation and recruitment domain; DUF, domain of unknown function; CC, coiled-coil domain; PDZ, postsynaptic density protein disc large tumour suppressor and zonula occludens-1 domain; SH3, src homology 3 domain; GUK, membrane-associated guanylate kinase domain. (B) Representative images of proximal pronephric tubule ciliation and morphology. Dotted lines indicate bounds of tubule assessed in the image. (C) Quantitation of cilia and tubule morphology rescue efficiency of wildtype and variant DLG5 mRNA demonstrate the differing functionality of DLG5 variants. Ratios are calculated as values from sides with mRNA along with MO divided by values from MO only sides. Red indicates ratios suggesting an exacerbation of the phenotype while green indicates ratios suggesting rescue of the phenotype. (D) Representative images and quantitation of brain ventricle morphology rescue efficiency of wildtype and p.Arg821Ter variant DLG5 mRNA demonstrate the loss of functionality of the p.Arg821Ter DLG5 variant. Statistical tests carried out as analysis of variance (ANOVA) followed by Dunnett’s multiple comparison test with ****p<0.0001, **p<0.005 and *p<0.05 (C) or an unpaired t-test test with *p<0.05 (D). Bars indicate mean and SD of individual values (C) or replicate means (D).

