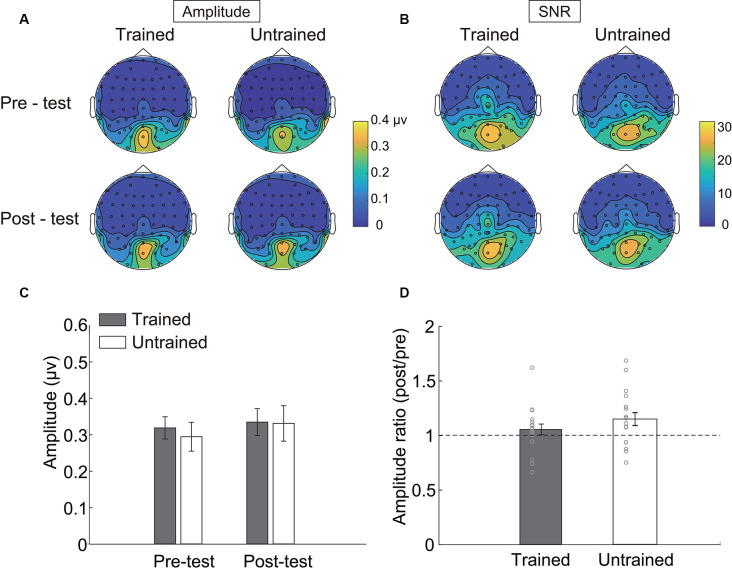
Figure 3.
Steady-state visual evoked potential (SSVEP) results. Topographical maps of (A) amplitude and (B) signal-noise-ratio (SNR) of four testing sessions. (C) The SSVEP amplitude of each condition. (D) The ratio of amplitude in the post-test to that in the pre-test. Error bars represent standard errors of means.

