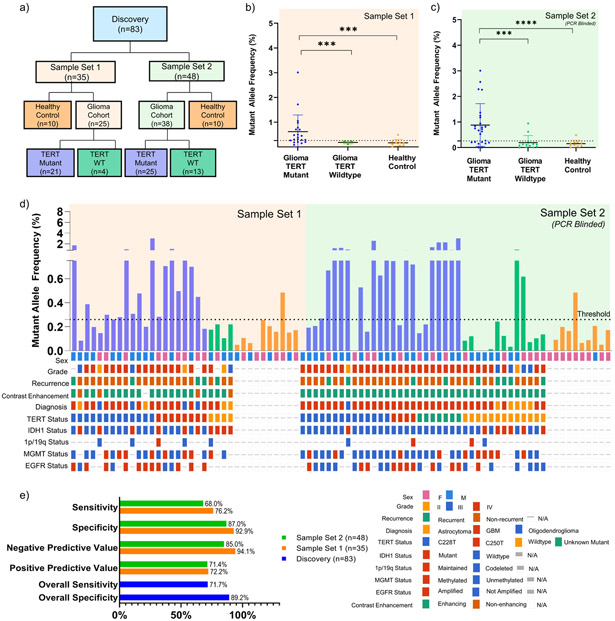
Figure 2. Detection of TERT Promoter Mutation in Plasma of Discovery Cohort.
(a) CONSORT diagram depicting patient cohorts and overall study design. (b) cfDNA from 2 mL of matched patient plasma from patient cohort 1 (21 TERT Mutant and 4 TERT WT; n=25) and healthy control (TERT WT; n=10) was used as input for absolute quantification of TERT mutant (C228T or C250T) and wildtype copies. (c) Plasma samples from PCR blinded sample set 2 (25 TERT Mutant and 13 TERT WT; n=38) and healthy control (TERT WT; n=10) was used as input for absolute quantification of TERT mutant (C228T or C250T) and analyzed using parameters established in sample set 1. All data is shown in MAF, calculated using the formula described in Methods and Supplementary Fig. 2. MAF of TERT Mutant for plasma samples are plotted against cohort sub-classification. Dotted line indicates a threshold of 0.26% MAF, used to designate samples as TERT Mutant positive or negative. (d) MAF of TERT Mutant are graphed according to sample number. Oncoprint depicting the genomic landscape of each sample are plotted underneath. (e) Contingency tables were constructed from data obtained, and sensitivity and specificity were calculated and graphed above. Overall sensitivity and specificity across both sample sets(n=83) are also reported.

