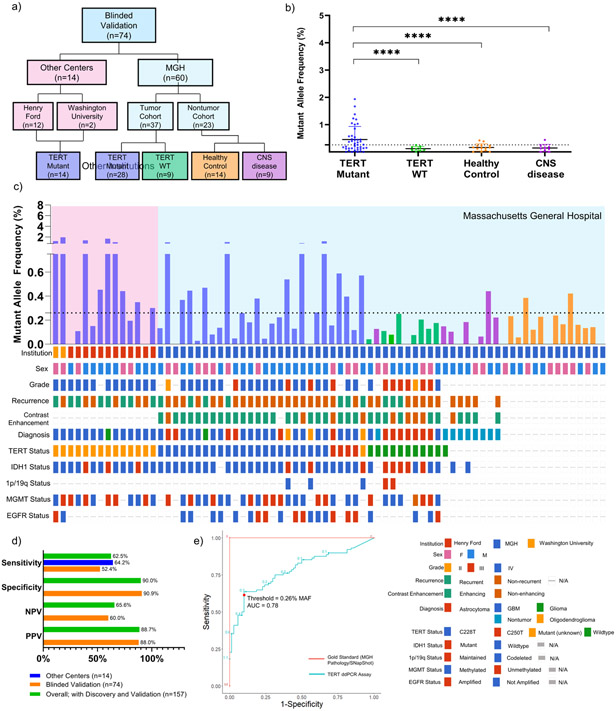
Figure 3. Detection of TERT Promoter Mutation in Plasma of Blinded Multi-Institution Validation Cohort.
(a) CONSORT diagram depicting patient cohort and design of multi-institution validation cohort. (b) cfDNA from 2 mL of matched patient plasma from blinded multi-institution cohort (n=74; n=14 outside institution, TERT Mutant, n=28 MGH TERT Mutant, n=9 MGH TERT WT, n=14 MGH healthy control, n=9 MRI positive non-tumor) was used as input for absolute quantification of TERT mutant and analyzed using the parameters established in the discovery cohort. Data is shown in MAF calculated using the formula described in Methods and Supplementary Fig. 2. MAF for all samples is plotted against sub-classification of patient samples. (c) MAF for all TERT Mutant plasma samples are graphed according to sample number, with an accompanying Oncoprint that depicts sample source and genomic landscape. Dotted line indicates threshold of 0.26% MAF used to designate samples as TERT Mutant positive or negative. (d) Analytical parameters were calculated from contingency tables and reported. (e) ROC Curve depicting change in sensitivity and specificity according to varying threshold. Red point indicates threshold used for analysis, 0.26% MAF. Gold Standard (MGH Pathology/SNapShot) is plotted in red, and TERT ddPCR Assay is plotted in blue.

