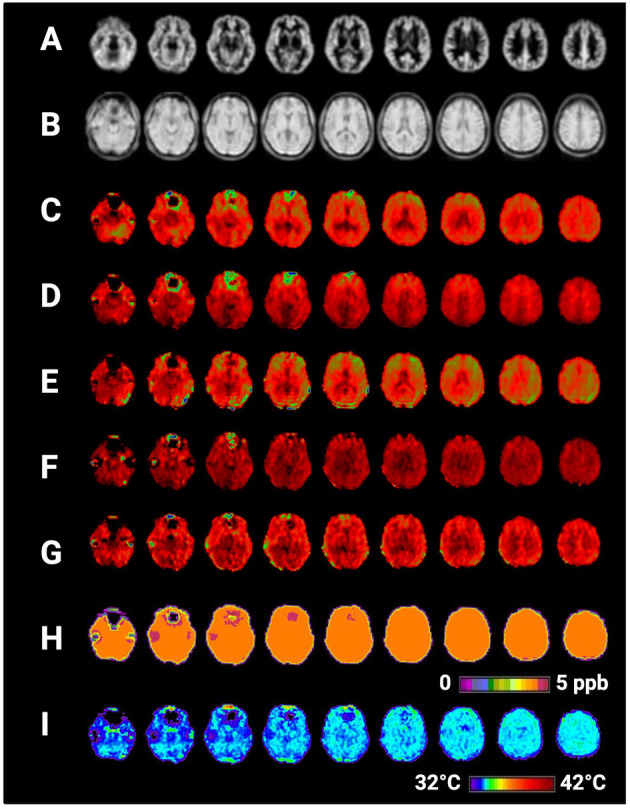
Figure 2.

Selected axial slices showing raw metabolite and brain temperature maps derived from a single participant's volumetric magnetic resonance spectroscopic imaging data (MRSI) data. Shown are (A) normalized gray matter volumes, (B) water reference signal, (C) total creatine (creatine + phosphocreatine), (D) total choline, (E) NAA (N-acetylaspartate), (F) myo-inositol, (G) Glx (combined signal from glutamine and glutamate), (H) frequency difference between water and creatine (ΔH20−CRE), (I) brain temperature calculated according to the equation TCRE = −102.61(ΔH20−CRE) + 206.1°C. Raw MRSI data were visualized within the Metabolite Imaging and Data Analysis System (MIDAS) software package, and the figure was created using BioRender.
