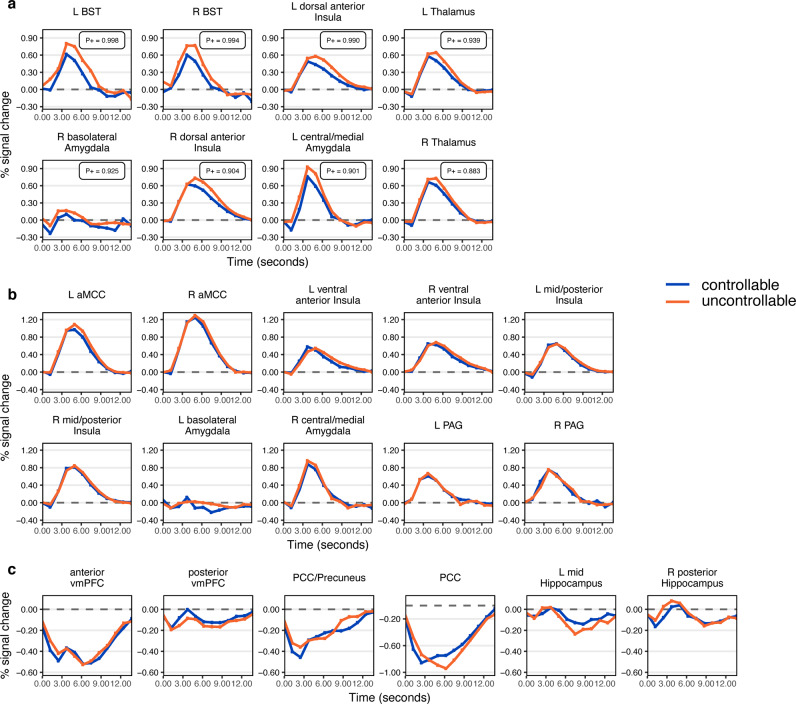
Fig. 4. Stressor-related responses at regions of interest.
Unassumed shape analysis was used to estimate evoked responses to stressors for all ROIs. a ROIs with stronger evidence of a controllability effect. P+ values (P(effect > 0)) shown. b–c Responses for the remaining ROIs, with the responses to the stressor that were positive-going in b and those that were negative-going in c. Mid and posterior Hippocampus ROIs are also shown in c.

