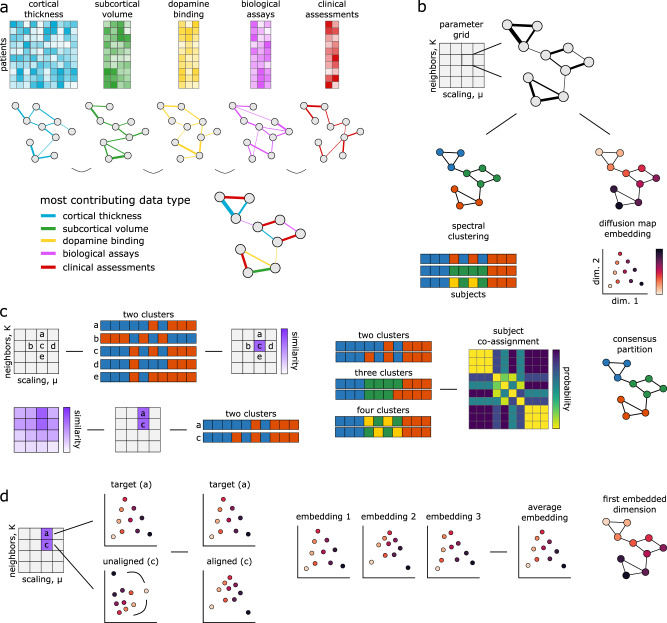
Fig. 1. Similarity network fusion analysis pipeline.
Toy example demonstrating the processing steps employed in the reported analyses; refer to Methods: Similarity network fusion for more detailed information. Patients are represented as nodes (circles) and the similarity between their disease phenotype is expressed as connecting edges. a Similarity network fusion generates patient similarity networks independently for each data type and then iteratively fuses these networks together. The resulting network represents patient information and relationships balanced across all input data types. b We perform an exhaustive parameter search for 10,000 combinations of SNF’s two hyperparameters (K and μ). The resulting fused patient networks are subjected to (1) spectral clustering and (2) diffusion map embedding to derive categorical and continuous representations of patient data, respectively. c We assess the local similarity of patient cluster assignments in parameter space using the z-Rand index80. The z-Rand index is calculated for all pairs of cluster solutions neighboring a given parameter combination [] and then averaged to generate a single “cluster similarity” metric. Clustering solutions from regions of parameter space with an average cluster similarity exceeding the 95th percentile are retained and combined via a consensus analysis to generate final patient clusters (see “Methods: Consensus clustering”)30,31. d Diffusion map embedding yields phenotypic “dimensions” of patient pathology38. Embeddings from stable regions of parameter space chosen in (c) are aligned via rotations and reflections using a generalized Procrustes analysis and averaged to generate a final set of disease dimensions.

