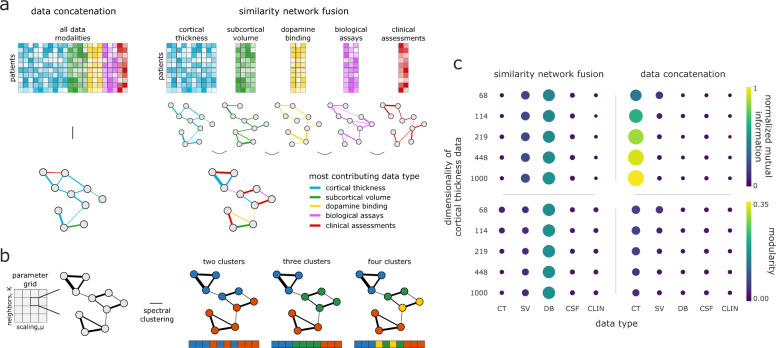
Fig. 2. Comparison of data concatenation and SNF for integrating data.
a Toy diagram depicting generation of a patient similarity network from data concatenation in contrast to SNF. The highest dimensionality data—in this case, cortical thickness—tends to be over-represented in the similarity patterns of the patient network generated with data concatenation, whereas SNF yields a more balanced representation. b An exhaustive parameter search was performed for 10,000 combinations of SNF’s two hyperparameters (K and μ). We subjected the resulting fused patient network for each combination to spectral clustering for a two-, three-, and four-cluster solution. Clustering solutions were combined via a “consensus” clustering approach (see “Methods: Consensus clustering”, Fig. 1c)30,31. c The impact of cortical thickness feature dimensionality on normalized mutual information (NMI) and modularity for different data modalities in data concatenation compared to SNF. NMI estimates are computed by comparing the clustering solutions generated from the concatenated/SNF-derived patient network with the solutions from each single-modality patient network. Modularity estimates are computed by applying the clustering solutions from the concatenated/SNF-derived patient network to the single-modality patient network. CT = cortical thickness; SV = subcortical volume; DB = DAT binding; CSF = CSF assays; CLIN = clinical-behavioral assessments.

