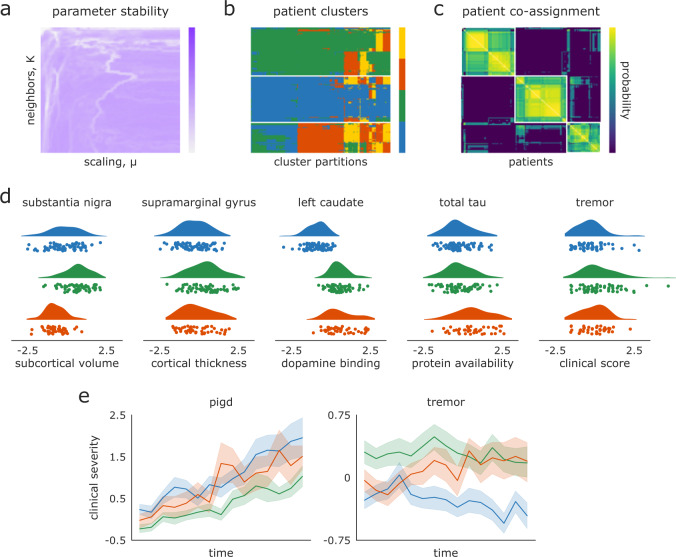
Fig. 3. Patient biotypes discriminate multimodal disease severity.
a Local similarity of clustering solutions for examined SNF parameter space, shown here for the three-cluster solution only. b Patient assignments for all of the two-, three-, and four-cluster solutions extracted from stable regions of the SNF parameter space in (a). The three-cluster solution is ostensibly the most consistent across different partitions. c Patient co-assignment probability matrix, indicating the likelihood of two patients being assigned to the same cluster across all assignments in (b). The probability matrix is thresholded based on a permutation-based null model and clustered using an iterative Louvain algorithm to generate consensus assignments (see “Methods: Consensus clustering”). d Patient biotype differences for the most discriminating feature of each data modalities at baseline. X-axis scales for all plots represent z-scores relative to the sample mean and standard deviation. Note that all ANOVAs with the exception of tremor scores are significant after FDR-correction (q < 0.05). Higher cortical thickness, subcortical volume, and DAT binding scores are generally indicative of clinical phenotype; refer to Supplementary Table 2 for guidelines on how biological assays and clinical-behavioral assessments coincide with PD phenotype. e Patient biotype differences for two relevant clinical-behavioral assessments over time; shaded bands in (e) indicate standard error. Linear mixed effect models were used to examine the differential impact of biotype designation on longitudinal progression of clinical scores; refer to Supplementary Table 4 for model estimates.

