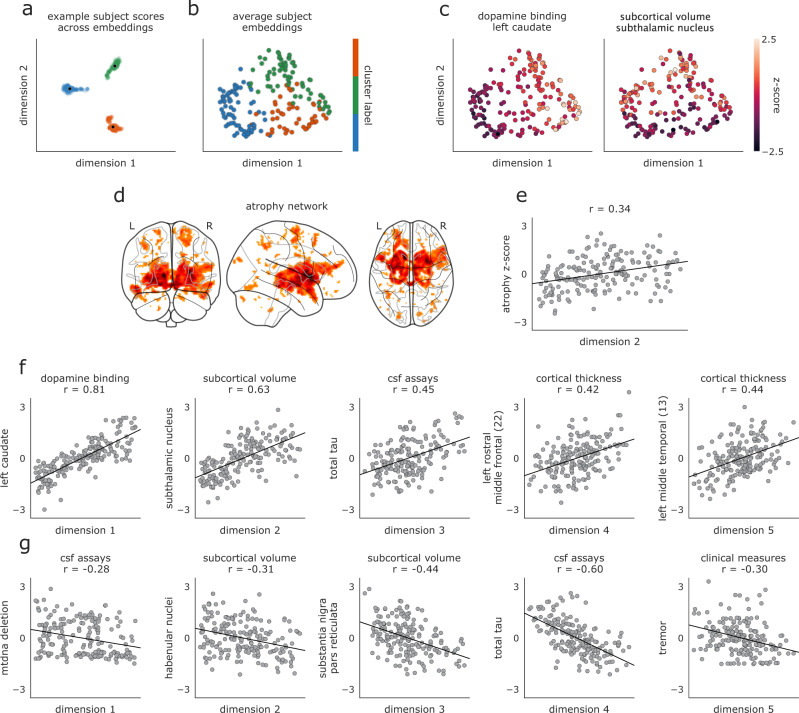
Fig. 4. Embedded patient dimensions capture relevant clinical information.
a Scores of three example patients (one from each biotype) along the first two embedding dimensions generated from all 1262 hyperparameter combinations retained in analyses; black dots represent average scores across all parameter combinations, which are shown for every patient in (b). b Scores of all patients along first two dimensions of average embeddings. Colors reflect the same biotype affiliation as shown in Fig. 3. c Same as (b) but colored by patients scores of the feature most strongly correlated with the first and second embedding dimensions. Left: colors represent DAT binding scores from the left caudate (r = 0.81 with dimension one). Right panel: colors represent subcortical volume of the subthalamic nucleus (r = 0.63 with dimension two). d PD-ICA atrophy network from11, showing brain regions with greater tissue loss in PD patients than in age-matched healthy individuals. e PD atrophy scores, calculated for each patient using the mask shown in (e), correlated with subject scores along the second embedded dimension shown in (a–c). f, g Features with the most positive (f) and negative (g) associations to the five embedding dimensions. Y-axes are presented as z-scores; x-axes are dimensionless units derived from the diffusion embedding procedure.

