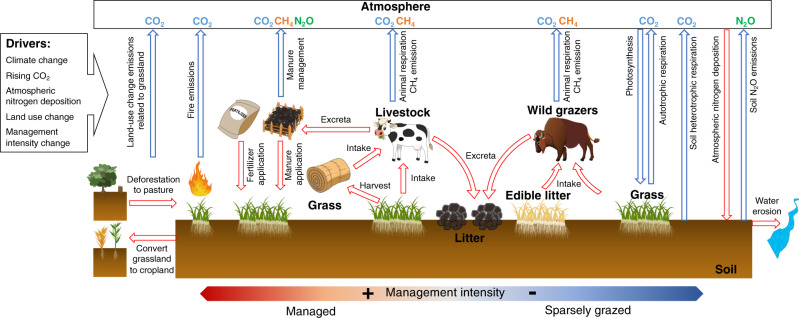
Fig. 1. Illustration of the processes and the greenhouse gas fluxes that are accounted for in this study.
The box with an arrow in the top left of the figure presents the drivers that used as input to the ORCHIDEE-GM v3.2. The processes and the greenhouse gas fluxes that are related to grassland are shown as red and blue arrows, respectively. The red-to-blue layout at the bottom of the figure indicates management intensity from high (red; intensively managed grassland) to low (blue; sparsely grazed and natural grassland).

