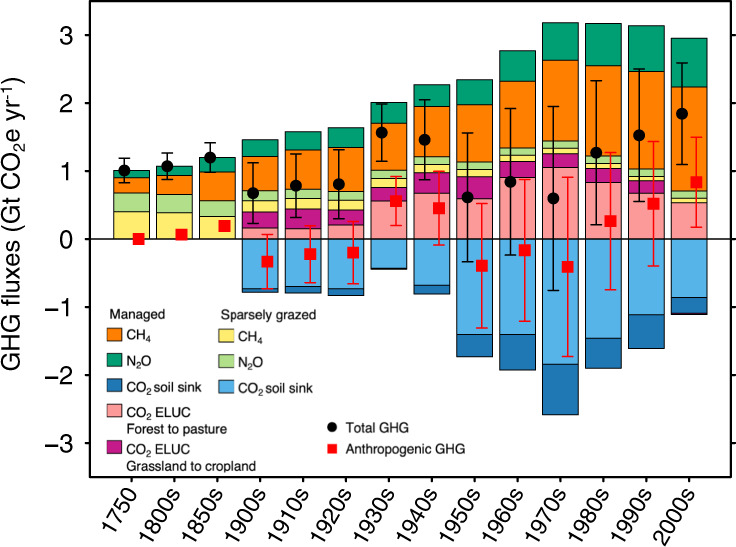
Fig. 2. The decadal greenhouse gas (GHG) fluxes of global grassland during the period 1750–2009.

Light and dark blue bars represent CO2 fluxes from managed and sparsely grazed grassland, respectively; orange and yellow represent CH4 fluxes from managed (domestic livestock) and sparsely grazed (wild grazers) grassland, respectively; light green and dark green represent N2O fluxes from managed and sparsely grazed grassland, respectively; and pink and purple represents land-use change emissions related to grassland from deforestation to pasture and from conversion of grassland to cropland, respectively. Black dots and their error bars indicate net total GHG balance and its 1-sigma uncertainty. Red squares and their error bars indicate the anthropogenic GHG balance after subtracting pre-industrial GHG fluxes. Negative values indicate GHG sinks and positive values indicate GHG sources.
